Android dominates the mobile ecosystem with over 72.7% global OS share. This dominance fuels the relevance of Android launchers as critical tools for personalization and productivity. Third-party launchers unlock custom interfaces and quicker navigation, benefiting everyday users and mobile-first businesses alike. For example, productivity-focused firms often deploy smart launchers to streamline workflow on company devices, while creative users rely on design launchers to tailor their home screens. Read on to uncover comprehensive stats that reveal how launchers shape today’s mobile experience.
Editor’s Choice
- 72.7% of smartphones run Android globally.
- The Android Launcher market is valued at $42.2 million in 2024.
- Forecasted drop to $24.1 million by 2031, with a –7.8% CAGR.
- In 2025, the market is estimated at $42.2 million, showing contraction.
- Asia‑Pacific leads regional market share for launchers.
- Android has around 3.5 billion active users in 2025.
- Android 15 is active on 26.75% of devices, the most widely used version.
Recent Developments
- Major market players like Nova Launcher, Smart Launcher, Action Launcher, and Niagara Launcher continue launching updates.
- Increasing mergers and partnerships are reshaping strategies across the launcher space.
- Innovations focus on smart features such as gesture controls and automated sorting.
- As system-level customization improves, third-party launcher usage is slowing.
- Benchmarking reports show rising competition around performance and usability.
- Industry reports highlight player comparisons and positioning strategies by top developers.
Overview of Android Launchers
- Android launchers provide the home screen, app drawer, and overall interface on Android devices, acting as the user’s gateway to apps and widgets.
- Many users turn to third-party launchers to gain deeper customization options beyond stock interfaces.
- Devices with heavily branded skins (e.g., Samsung’s One UI) still see considerable third-party launcher adoption, especially among power users.
- As of 2025, the Android launcher market is valued at $42.2 million, reflecting sustained interest in personalization.
- However, forecasts show a shrinking market, with projections to decline to around $24.1 million by 2031 (a CAGR of –7.8%).
- The decline partly stems from improved built‑in customization features in native Android versions.
- At the same time, the user base grows: there are 4.2 billion Android users in 2025, up from 3.9 billion in 2024.
Global Market Size and Growth Trends
- Market valuation: $42.2M in 2024, consistent into 2025.
- Forecasted decline to $24.1M by 2031 at a 7.8% CAGR.
- The historical period (2019–2024) saw demand rise for customizable, high-performance launchers.
- Forecast anticipates slower growth as native Android customization improves.
- Asia-Pacific remains the largest regional market share.
- Mobile phones account for the majority, and tablets follow.
- Market maturity and user adoption saturation act as headwinds.
- Smart and design segments remain key categories influencing growth.
Android Launcher Market Share Breakdown
- In 2023, the global Android launcher market stood at $47.76 million, decreasing from previous peaks.
- By 2025, market value eased to approximately $42.2 million, continuing a downward trend.
- Forecasts estimate a further drop to $24.1 million by 2031, averaging a –7.8% CAGR.
- Mobile phones remain the dominant application segment, outpacing tablets and other devices.
- Design-focused launchers and smart launchers (with features like gestures and automation) are key market segments.
- The market consolidation hints at a few key players (e.g., Nova, Niagara, Smart, and Action) dominating revenue share.
Steady Decline in Android Launcher Market
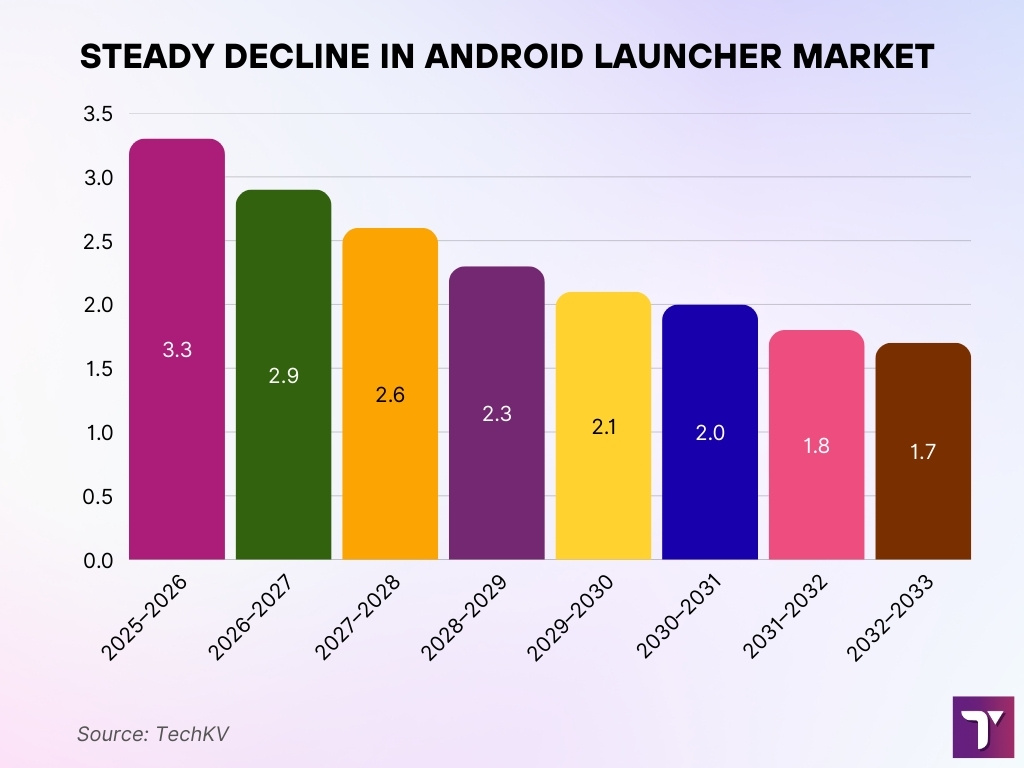
- The Android launcher market is experiencing a steady decline, with negative growth forecasted throughout 2025 to 2033.
- In 2025–2026, the market is expected to shrink by -3.3%, marking the sharpest annual decline in the forecast period.
- The rate of contraction gradually slows down each year, with -2.9% in 2026-027, -2.6% in 2027-2028, and -2.3% in 2028-2029.
- By 2029–2030, the decline tapers to -2.1%, and further eases to -2.0% in 2030-2031.
- In the final projected years, 2021-2032 and 2032-2033, the market shrinks only slightly by -1.8% and -1.7% respectively.
- The data suggests a decelerating decline, possibly due to market stabilization, niche adoption, or integration of innovative features in select launchers.
- This trend reflects growing competition from native Android customization features and OEM-specific launchers, which reduce the need for third-party alternatives.

User Adoption and Active User Statistics
- Android had 3.5+ billion active users in 2025.
- Android OS accounts for 72.7% of mobile and tablet devices globally.
- Approximately 70-72% global mobile OS share per multiple reports.
- Third‑party launcher adoption rates are high in customization enthusiast segments.
- Growth in user numbers is slowing due to the saturation of personalization needs.
- Launchers remain critical among users seeking optimized workflows.
- Rising native features may reduce new installation rates.
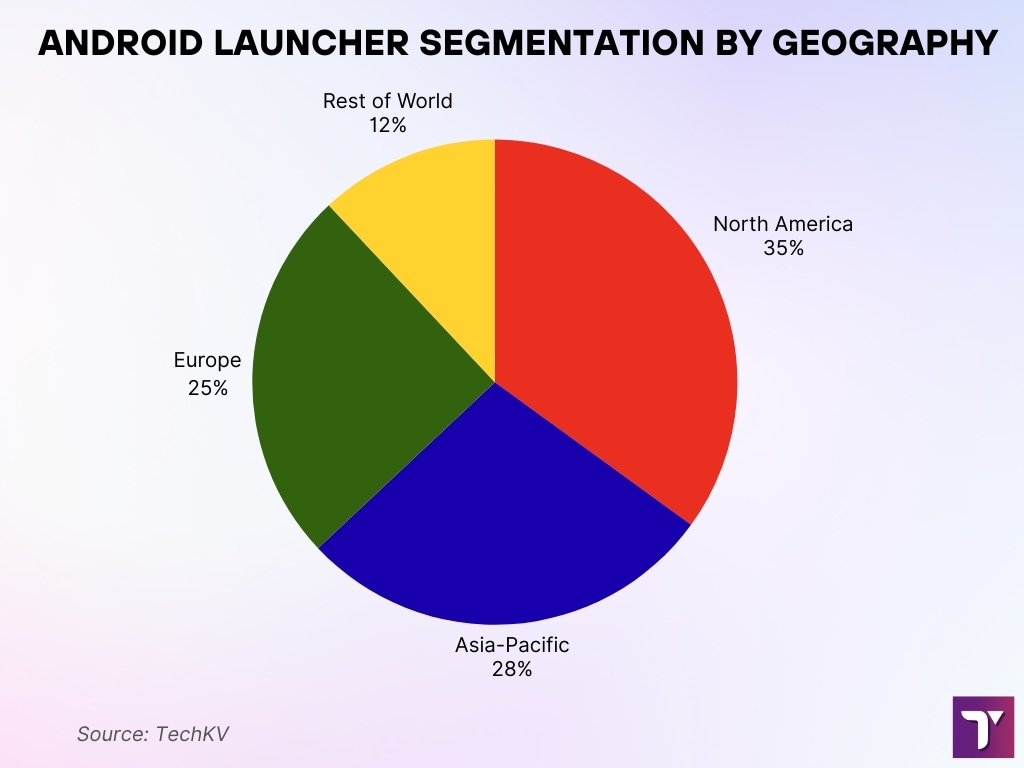
Android Launcher Segmentation By Geography
- North America: 35% – Largest regional market share
- Asia-Pacific: 28% – Second-largest, reflecting rapid digitalization and investment
- Europe: 25% – Significant adoption driven by GDPR and enterprise security initiatives
- Rest of World: 12% – Includes regions outside North America, Europe, and Asia-Pacific

Application Segment Statistics (Mobile Phones vs Tablets)
- Android powers a global mobile OS share between 70.8 % and 72 % in 2025, with mobile devices dominating usage over tablets.
- In the U.S., Android holds just 42.34 % of the mobile OS market, indicating iOS still leads there.
- Worldwide Android user base reaches 3.3 billion in 2025, underscoring its massive presence in mobile devices.
- Mobile phone usage still vastly outpaces tablets; no specific launcher stats by device type are available, but hallmarks of mobile-first design remain prevalent.
- Android 15 is the most-used version on smartphones at 27 %, followed by Android 14 at 19 %.
- For tablets, Android 14 leads at 20 %, while usage of supported versions (Android 13+) stands at only 41 %, suggesting many tablet users are on older, unsupported builds.
- These version gaps highlight that third-party launchers might still thrive on devices where system-level customization is limited by outdated OS versions.
- Android dominates tablets globally but faces more fragmentation, offering room for consistent launcher solutions where OEM skins fall short.
User Demographics and Preferences
- Android appeals most strongly in Asia, Africa, and South America, where it holds over 85 % regional market share.
- In the U.S., iOS exceeds Android with 57.68 % of the device market, compared to Android’s 42.06 %.
- Among Android users, those seeking deep customization and productivity tools tend to choose third-party launchers like Nova and Action Launcher.
- Minimalist launchers (e.g., Niagara, Olauncher, Yin Yang) are growing with users looking to reduce visual clutter.
- No quantitative age, income, or demographic split on launcher use is readily available, but regional and interface preference trends are clear from global market data.
- Strong interest from regions with less access to later Android versions likely drives continued demand for launchers offering custom theming and features.
Privacy and Security Adoption Statistics
- Android saw an 80% surge in mobile app cyberattacks in 2024.
- In 2025, 3 in 4 mobile apps contain at least one vulnerability, and the average breach costs reached $4.76 million.
- Over 300 malicious “vapor” apps on Google Play have been downloaded more than 60 million times, often disguised as utilities.
- Android still requests 89% of potentially dangerous permissions, compared with 39% on iOS.
- Studies of third-party SDKs found 30% lacked a privacy policy, 37% over-collected user data, and 88% misrepresented sensitive data access.
- Empirical research into Android security apps revealed 20% potentially resell user data, and 50% fail to detect malware reliably.
- Android 13 introduced new privacy tools like selective media pickers, restricted folder access, and granular notification permissions.
- Google rolled out advanced anti‑fraud features in 2025 to help prevent scams, spoofing, and unauthorized permission changes.
US Cybersecurity Market Size and Solution Segmentation
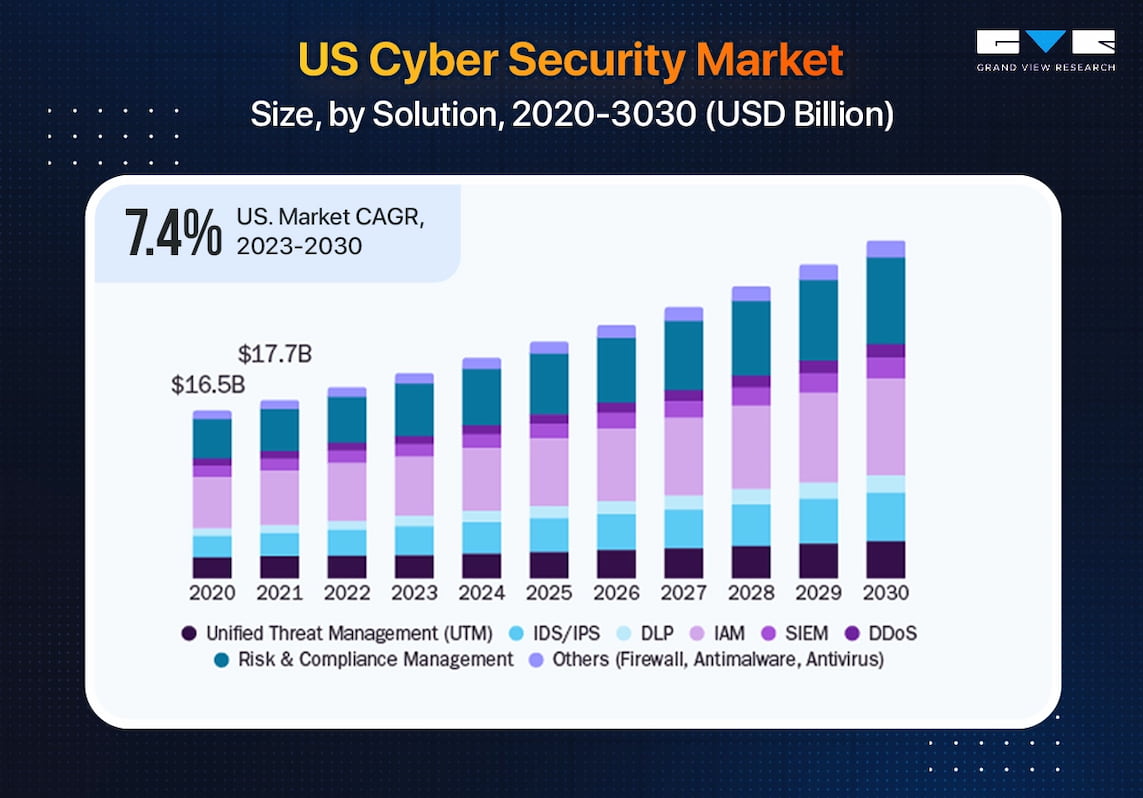
- The US cybersecurity market is projected to grow at a CAGR of 7.4% from 2023 to 2030.
- The market was valued at $16.5 billion in 2020 and increased to $17.7 billion in 2021.
- By 2030, the market size is estimated to exceed $25 billion, indicating consistent annual growth.
- Key cybersecurity solutions contributing to the market include:
- Unified Threat Management (UTM)
- Intrusion Detection and Prevention Systems (IDS/IPS)
- Data Loss Prevention (DLP)
- Identity and Access Management (IAM)
- Security Information and Event Management (SIEM)
- DDoS Protection
- Risk & Compliance Management
- Others (including Firewall, Antimalware, and Antivirus tools)

Premium vs Free Launcher Usage
- The global Android launcher market was valued at $42.2 million in 2024, with forecasts predicting a drop to $24.1 million by 2031.
- A Q1 2025 estimate places the global market at about $26.9 million, suggesting some fluctuation depending on the data source.
- Launchers often use a freemium model, offering basic features free and charging for advanced tools (e.g., icon pack support, custom gestures).
- The segment with paid upgrades includes Action Launcher Plus, Pear Launcher Pro, and Smart Launcher Pro, commonly priced between $5–$7.
- Free launcher downloads outnumber paid ones by a wide margin.
- Most users stick with no-cost options, likely due to Android’s built-in capabilities improving steadily.
- Regions like Asia-Pacific, with high demand for customization but price-sensitive markets, still see uptake of free tools, while paid upgrades remain niche or used by enthusiasts.
- The shrinking market value suggests paid upgrades may be under pressure, with most developers relying on ad revenue, donation tiers, or one-time fees to sustain updates.
- Overall, free launchers dominate downloads and user base, with premium versions serving power users who demand deeper customization and are willing to pay for sustained support.
Decline and Growth Drivers in the Launcher Market
- The overall market valuation stands at $42.2 million in 2025, with a projected –7.8% CAGR from 2019 to 2033.
- Decline driven by improved native customization and market saturation.
- Innovation remains a growth driver; gesture-based navigation, AI suggestions, and widget integrations keep engagement fresh.
- Demand remains stable in regions where custom launchers enable lightweight, efficient interfaces.
- Security concerns around data privacy and malicious apps may hinder adoption in sensitive markets.
Impact of Native Android Customization on Third-Party Launchers
- Native Android has empowered more customization within system UIs, reducing reliance on third‑party launchers, contributing to a negative CAGR of –7.8% for the launcher market from 2019 to 2033.
- Google’s March 2025 update improved support for third‑party launchers on Pixel devices, eliminating animation stutter and improving fluidity, making launchers like Nova feel smoother.
- Nonetheless, some manufacturers still limit support; OEM skins or gesture systems may break third‑party launcher functionality, frustrating users.
- Fragmentation in devices and divergent behaviors across hardware and OS builds create inconsistencies for launcher apps. In one study, 2,357 of 20,000 apps showed device‑specific behavior issues due to fragmentation.
- OEM customization (like Samsung’s One UI enhancements via Good Lock) provides launcher-like tweaks without installing external apps, reducing the incentive for third‑party installs in some user segments.
- Material Design updates, like Android 16’s Material 3 Expressive and desktop mode for tablets, could shift user expectations, prompting launcher developers to adapt or risk obsolescence.
- In summary, native updates both threaten third‑party launchers by fulfilling customization needs, and help them, via improved compatibility, when system-level integration improves. It’s a delicate balance that developers must navigate.
Launcher Churn and Retention Rates
- Average day‑one retention for mobile apps is ~25%, dropping to under 10% by week two, and 71% churn by 90 days.
- By day 30, only around 5–6% of users remain active, consistent with app benchmarks.
- Launchers likely follow similar patterns, although no launcher-specific rates are published.
- Sustained retention depends on continuous updates, strong performance, and meaningful features.
- Cohort analysis helps developers measure retention among new vs. all users, gauging loyalty and value.
- Minimalist launchers may retain more engaged users seeking simplicity, but still face churn pressures.
- Launchers with strong community feedback and regular improvements tend to retain user interest longer.
Conclusion
The Android launcher ecosystem reflects both innovation and consolidation. As the market contracts under pressures from native enhancements and user saturation, standout launchers differentiate themselves with gesture-driven design, AI features, widget integration, and privacy-conscious functionality. Security vulnerabilities and malicious apps remain a major concern, placing importance on trustworthy development. Retention challenges persist across the board, demanding constant improvement and user engagement. Looking ahead, only launchers that combine meaningful utility, performance, and transparency will maintain relevance.
