Mobile and desktop both shape how we access the web, but mobile clearly pulls ahead in most metrics. Two real-world examples show this shift: e-commerce brands ramp up mobile-first checkout experiences, and media platforms optimize video feeds for mobile screens. Let’s explore the stats driving these trends.
Editor’s Choice
- 59–64% of global web traffic now comes from mobile devices in 2025.
- Mobile traffic first passed 50% in Q4 2016.
- In the U.S., mobile accounts for roughly 47–57% of traffic.
- Android leads in usage with ~73% of mobile OS share, and iOS holds the remainder.
- Desktop still dominates some regions, e.g., Europe holds closer to 45–50% desktop share.
- Mobile traffic surged from under 1% in 2009 to over 64% in mid-2025.
- Key growth drivers: video consumption, social media, and mobile-friendly site designs.
Recent Developments
- As of July 2025, 64.35% of global web traffic originates from mobile devices, up from ~62.5% in early 2025.
- Late 2024 estimates place mobile share at 64.04%, and desktop at 35.96%.
- April 2025 data shows mobile traffic ranges between 59.6% and 59.7%, depending on the source.
- The trend is clear: mobile dominance in internet usage continues to grow steadily.
Mobile vs Desktop Market Share
- Worldwide in July 2025, mobile holds 59.3%, desktop 40.7%.
- April 2025 values reflect about 59.6–59.7% mobile share globally.
- The gap between platforms narrowed in earlier years, but mobile still leads by nearly 20 percentage points.
- Tablet share remains minor (often 1–2%), not shifting the broader picture.
Desktop vs Mobile Market Share Insights
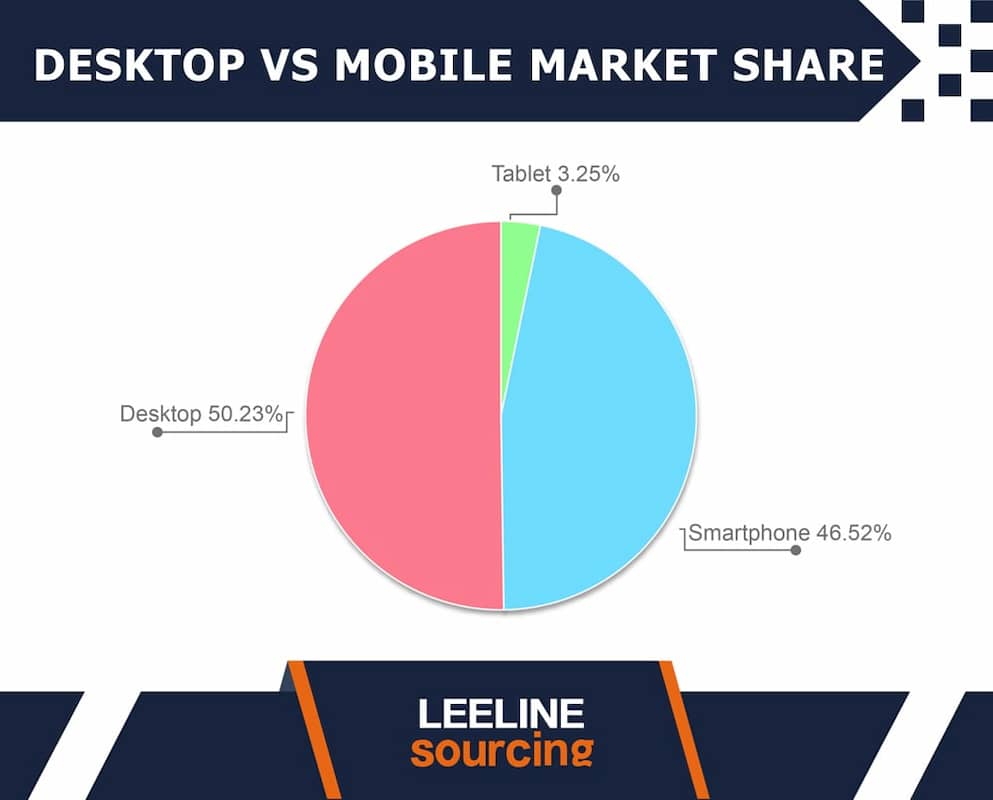
- Desktop usage leads with 50.23%, holding the largest share of the market.
- Smartphones are close behind at 46.52%, showing the growing dominance of mobile browsing.
- Tablets contribute only 3.25%, indicating their minimal role compared to desktops and smartphones.
- The gap between desktop and smartphone is less than 4%, highlighting a highly competitive balance between the two.
- Businesses should note that mobile devices (smartphones + tablets) together account for 49.77%, nearly equal to desktops.

Global Internet Traffic: Mobile vs Desktop
- Online traffic from mobile accounts for 62.45%, desktop just 35.71%, tablet holds ~1.84%.
- Some sources report a 64.35% mobile share in mid-2025.
- Differences across sources (around 2 percentage points) reflect methodology and timing variations.
- Desktop still matters, but mobile has become the dominant delivery channel for web content.
Trends in Mobile vs Desktop Internet Traffic Over Time
- In Q1 2009, mobile traffic was a mere 0.72% of global web activity; by Q3 2025, it soared to 64.35%.
- Mobile first crossed the 50% threshold in Q4 2016.
- Late 2014 data showed desktops dominating; today, mobile roughly doubles desktop usage.
- The growth arc remains steep, especially driven by emerging markets, apps, and better mobile networks.
Regional Variations in Mobile and Desktop Usage
- U.S. internet traffic, mobile accounts for around 56.75%, desktop 43.25% as of late 2024.
- In early 2025, the U.S. desktop share held at ~50.2%, with mobile at 47.3%.
- Asia–Pacific leads global mobile adoption, e.g., India sees 80.3% of traffic via mobile, and desktop only 19.7%.
- UK and Canada trends show a modest mobile advantage, e.g., UK mobile 56.9% vs desktop 43.1%.
- Europe remains more balanced, with about 52% mobile and 45% desktop.
Key Insights: Mobile vs. Desktop Internet Traffic by Region
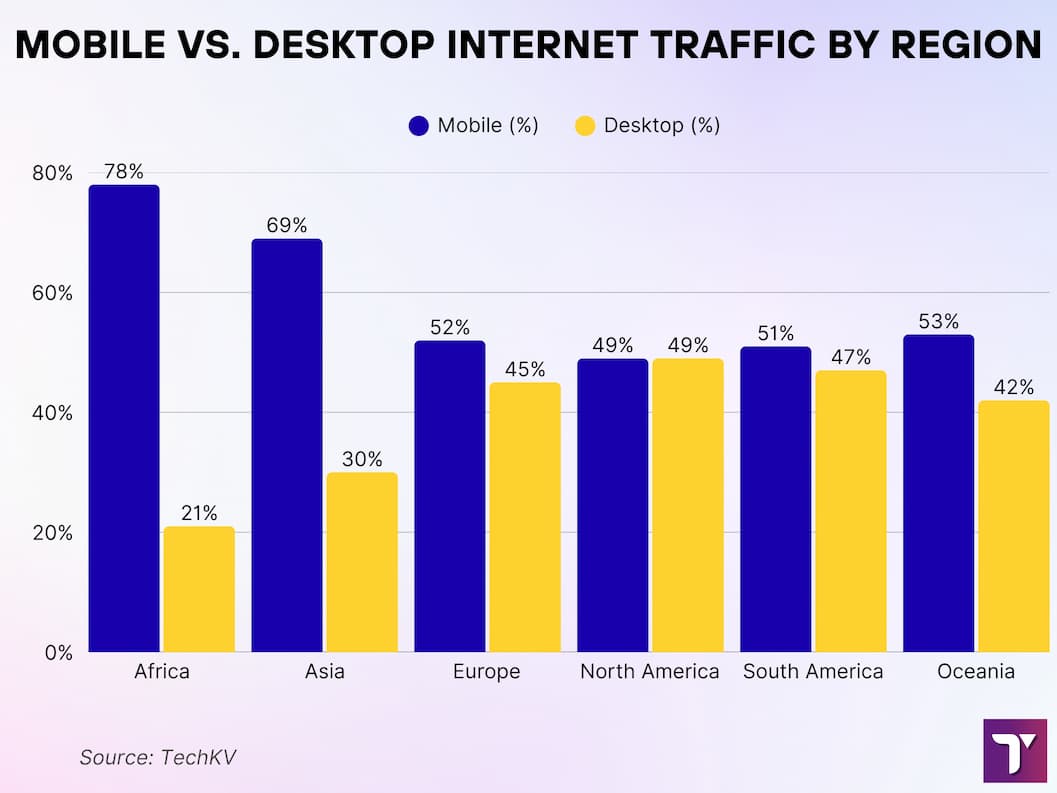
- Africa has the highest mobile usage (78%), with desktops at only 21% and tablets nearly negligible (1%).
- Asia follows with 69% mobile traffic, but desktop usage is higher here compared to Africa (30%).
- Europe shows a more balanced trend: 52% mobile and 45% desktop, with tablets at 3%.
- North America is evenly split, with 49% mobile and 49% desktop, making it the most balanced region.
- South America leans slightly toward mobile (51%) over desktop (47%), with tablets at 2%.
- Oceania also shows balance but with more mobile presence: 53% mobile, 42% desktop, and the highest tablet usage (5%) across all regions.

Mobile vs Desktop User Behavior and Engagement
- Mobile users are more prone to quick interactions, and 65% of businesses adopt PWAs, boosting user engagement by 137% over classic mobile sites.
- Desktop sessions often involve deeper browsing, e.g., higher conversion rates for complex tasks or research behaviors.
- Mobile shoppers favor convenience and spontaneity, while desktops cater better to considered purchases.
- Cross-device behavior is increasingly common; 76% of users switch between mobile and desktop mid-task.
- Adoption of cloud sync rises, 42% year-over-year, making cross-device journeys smoother.
- Mobile’s immediacy drives frequent engagement, think social scrolls, news checks, or app alerts.
- Desktop remains vital for multitasking, professional workflows, and long-form content consumption.
Mobile vs Desktop Website Visits and Unique Visitors
- Mobile now dominates unique visitor counts across sectors, especially in news and publishing. Mobile consistently beats desktop for reach.
- E-commerce sees 72.9% of transactions on mobile in 2024, with 79.4% of smartphone users expected to buy via mobile in 2025.
- In the U.S., 187.5 million people (≈66%) will have made at least one mobile purchase in 2025.
- Desktop remains relevant for sectors like luxury, electronics, or travel, where users use more detailed screens to review options.
- Many users begin journeys on mobile but complete purchases on desktop, a testament to cross-platform behavior.
- Publishers report high unique visitor counts from mobile, reflecting mobile’s role as the primary content access point.
Website Traffic Insights (Desktop & Mobile Share)
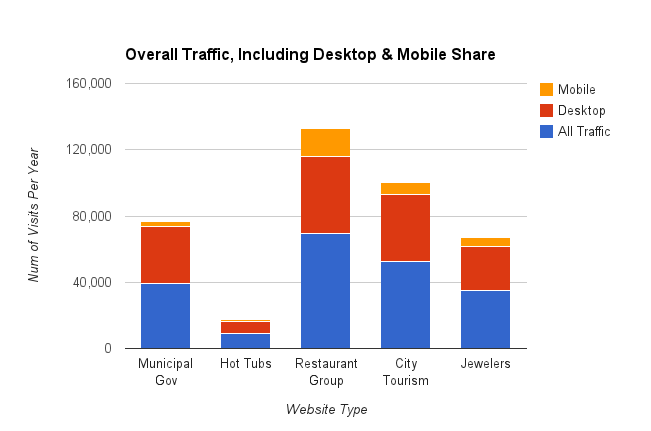
- Municipal Government websites receive around 40,000 visits per year, with the majority (35,000) from desktop users and only 5,000 from mobile.
- Hot Tub websites show the lowest traffic overall at just 8,000 visits annually, with 5,000 desktop and 3,000 mobile visits.
- Restaurant Group websites dominate with 75,000 visits per year, making them the highest traffic category. Of these, 42,000 come from desktop and 12,000 from mobile.
- City Tourism websites attract about 50,000 visits annually, with a heavier share from desktop (37,000) compared to mobile (8,000).
- Jewelry websites see around 35,000 visits per year, split into 25,000 desktop and 5,000 mobile visits.

Bounce Rates: Mobile vs Desktop
- In 2025, average mobile bounce rates range between 58.45% and 60.19%.
- Desktop bounce rates are substantially lower, about 48.38% to 50.33%.
- Mobile bounce rates remain roughly 12% higher than desktop in 2025, highlighting lower session depth.
- The disparity underscores the need for faster loading and streamlined content on mobile.
- Site performance matters; slow loading adds 32%–123% chances of abandonment depending on the delay.
Average Time Spent on Site: Mobile vs Desktop
- One source reports mobile session durations at 3 hours 46 minutes, while desktop averages 2 hours 52 minutes.
- Despite shorter, more frequent sessions, mobile can yield longer total viewing time across users.
- Desktop sessions tend to be longer per visit, owing to focused tasks like editing, shopping, or research.
- Mobile’s advantage is in frequency; push notifications, social scrolling, and quick searches add up.
Page Views per Visit: Mobile vs Desktop
- While specific numbers for 2025 are scarce, the elevated desktop session depth suggests higher pages per visit.
- Mobile’s elevated bounce rate (≈60%) implies users see fewer pages per session.
- Publishers optimize mobile flows with infinite scrolls and tap-driven navigation to boost page views.
- PWAs help retain users longer with app-like navigation and faster load experiences.
- Cross-device tasks often lock in page-view counts when finishing on a desktop.
Mobile vs Desktop Ownership Statistics
- Android dominates the mobile market with ~72.7% share, while iOS holds ~26.9% as of May 2025.
- On desktops, Windows leads with ~70.3%, macOS at 13.5%, and Linux + ChromeOS combine for about 5.9%.
- Among Steam gamers (desktop-centric), Windows users are ~95.5%, with macOS and Linux trailing.
- Device ownership mirrors usage; Android devices are far more common globally, while Windows rules PCs.
Mobile Operating Systems Market Share (Android vs iOS)
- In 2025, Android commands 76% of global mobile OS usage, iOS holds 19%, with HarmonyOS at around 5%.
- Android’s lead reflects its affordability, broad manufacturer adoption, and growth in emerging markets.
- iOS maintains strong shares in markets like the U.S., Japan, and Western Europe.
Mobile vs Desktop Internet Speed Comparison
- 5G offers roughly 10× faster speeds than 4G, reaching theoretical peaks of 20 Gbps, though real-world averages are lower.
- In the U.S., T-Mobile has recorded an average 5G download speed of around 186 Mbps.
- Lithuania averages >100 Mbps mobile download speeds and >150 Mbps fixed broadband speeds as of 2025.
- The U.S. overall average internet download speed (all platforms) is 209 Mbps, with upload speed at 62 Mbps.
- Globally, mobile median download speeds vary widely; rich economies range from 200–500 Mbps, while others are much lower.
- Higher speeds improve mobile engagement, reducing bounce and improving conversions.
- Desktop speeds are typically more stable, yet mobile is quickly catching up thanks to 5G and infrastructure upgrades.
Mobile vs Desktop Traffic by Industry or Website Type
- Health & beauty e-commerce sees 67% of orders from mobile, 18% from desktop.
- 69% of consumers use smartphones to stream digital video, and only 25% rely on desktops.
- 70.1% of users globally play video games on their smartphones, and 35.8% use desktops.
- Reddit receives around 5.9 billion mobile visits versus 1.67 billion from desktops.
- ChatGPT logs 1.17 billion mobile visits and 1.12 billion desktop visits monthly.
- eBay totals 327 million mobile visits and 308 million desktop visits monthly.
- Mobile dominates content consumption, and desktop still holds ground in complex workflows or high-investment tasks.
Impact of 5G and Mobile Network Technology on Usage
- At the end of 2024, 35% of mobile data traffic used 5G, expected to rise to 80% by 2030.
- In 2025, 5G will power 80% of mobile traffic, enabling new applications.
- Over 2.25 billion 5G connections exist globally, accelerating at ~4× previous growth.
- Nearly 50% of 5G users have added or are interested in extra services like content subscriptions or cloud gaming.
- T-Mobile sees strong demand for premium 5G plans, forecasting 5.5–6 million net additions in 2025.
- India’s 5G subscriptions reached 290 million, representing 24% of its mobile base.
- Europe lags with <50% 5G coverage, compared to 90% in the U.S. and 95% in Asia.
Mobile First vs Desktop Preferences in Different Regions
- As of early 2025, mobile accounts for 59.6% of web usage globally, and desktop has declined to 38.1%.
- Asia-Pacific leads, with 71% of internet traffic on mobile.
- Europe remains balanced, 52% mobile, 45% desktop.
- November 2024, India sees 80.31% mobile traffic, and China follows with 66.06%.
- U.K. mirrors global trend, 56.86% mobile vs 43.14% desktop.
- Some mobile-first economies, like Sudan (94.7%) and Nigeria (85.6%), show near-total mobile usage.
- West-friendly regions like the U.S. and Europe still show a strong desktop foothold alongside mobile.
Mobile vs Desktop eCommerce and Online Shopping Trends
- In the U.S., 15% of adults only use mobile for internet access (2024).
- E-commerce mobile transaction share reached 72.9% in 2024, with 79.4% of smartphone users expected to shop via mobile in 2025.
- 66% of U.S. users will make at least one mobile purchase in 2025, about 187.5 million people.
- Mobile-first design improves checkout conversion and reduces dropoff in many retail sectors.
- Retail verticals like fashion, groceries, and fast-moving goods see heavier mobile reliance.
- Desktops still dominate luxury, B2B, and high-value item shopping, where users research extensively.
Device Switching and Cross-Platform Usage Patterns
- 76% of users switch between mobile and desktop during a task.
- Cross-device paths are common, for example, researching on a desktop and checking out via mobile.
- Browser syncing, login persistence, and adaptive experiences are critical to maintaining user continuity.
- Cloud-based bookmarks, carts, and notifications support seamless transitions.
- App–web overlap often starts on mobile apps and finishes on desktop for conversion.
Emerging Technologies Affecting Usage (PWAs, AR/VR, AI)
- PWAs raise engagement; some report a 137% boost compared to traditional mobile websites.
- Mobile AR/VR usage is growing, especially in retail (virtual try-ons) and gaming.
- AI-powered personalization, from chatbots to recommendations, drives deeper engagement across devices.
- Cloud gaming and bandwidth-heavy services benefit from 5G speed and low latency.
- Integration of AI, AR, and PWAs is making mobile experiences richer and closing the desktop gap for complex tasks.
Future Predictions for Mobile and Desktop Usage
- By 2030, 5G will carry ~80% of mobile data traffic, radically shifting usage patterns.
- Mobile share of web traffic looks set to hit 65–70% globally.
- Cross-device workflows will increase, and designers must create holistic experiences.
- Desktop remains essential for detail-oriented and complex tasks, mobile will lead in convenience and ubiquity.
- Emerging markets will remain predominantly mobile-first for the next decade.
Conclusion
These days, mobile devices firmly lead in most internet metrics, from traffic share and engagement to speed and ecommerce. Yet desktop remains indispensable for deeper, complex tasks. Adoption of 5G and emerging technologies like PWAs, AR, and AI is blurring the lines between platforms. The key for businesses today is to master mobile-first design while ensuring seamless cross-platform continuity, ensuring no user is left behind, whatever device they start with.
