It’s no surprise that the iPhone has one of the most loyal user bases. It is primarily because of how attractive the ecosystem is. But have you wondered how different parts of the world and age groups use their iPhone devices? These numbers may amaze you and give some insights about how powerful Apple’s smartphones are.
Some General Stats on iPhone Usage
- In 2025, Apple sold over 1.36 billion iPhones across all models globally.
- The number of daily active iPhone users in the U.S. stands at 92 million, showing continued strong engagement.
- Customer satisfaction remains high, with 97.8% of users expressing they are happy with their iPhone experience.
- On average, users keep their iPhones for 4.2 years before upgrading.
- 88% of iPhone users have updated to the latest iOS version, reflecting Apple’s ecosystem loyalty.
- The Apple App Store now offers over 2.4 million apps for iPhone and iPad users.
- The average annual spend on apps per user has climbed to $84.
- Security and privacy continue to be top drivers for Android users switching to iPhone.
- Touch ID or Face ID is actively used by 91% of iPhone users.
Global Mobile OS Market Share
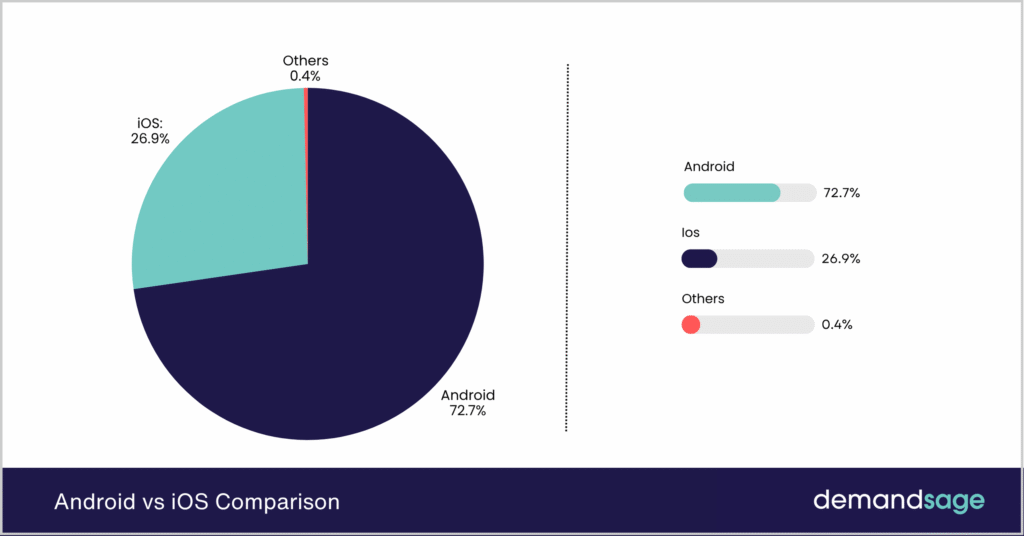
- Android dominates the market with a 72.7% share, making it the clear leader in global smartphone usage.
- iOS follows with a 26.9% share, maintaining a strong presence, especially in developed markets.
- Other operating systems account for only 0.4%, reflecting a sharp decline in alternative platforms.
iPhone Usage by Region
- North America leads iPhone adoption, with 52% of the population in the U.S. and Canada actively using an iPhone.
- In Europe, about 37% of smartphone users prefer an iPhone, reflecting steady regional loyalty.
- In Japan, over 55% of smartphone users use iPhones, maintaining Apple’s dominance in the country.
- In India, iPhone usage has grown to around 6.2%, driven by rising demand in urban areas and middle-income groups.
General iPhone App Retention Trends
- TikTok, Instagram, WhatsApp, YouTube, and Facebook remain the top 5 most-used iPhone apps in 2025.
- The average iPhone user now spends over 4.3 hours daily on apps.
- The app retention rate stands at 41%, meaning only 41% of users return to an app 30 days after installation.
- Around 39% of users abandon an app within 24 hours, while 16% keep it for a day, and 8% use it for about a week.
- Only 37% of iPhone users continue using an app 30 days after downloading it, showing high churn.
Apple Revenue Breakdown by Product
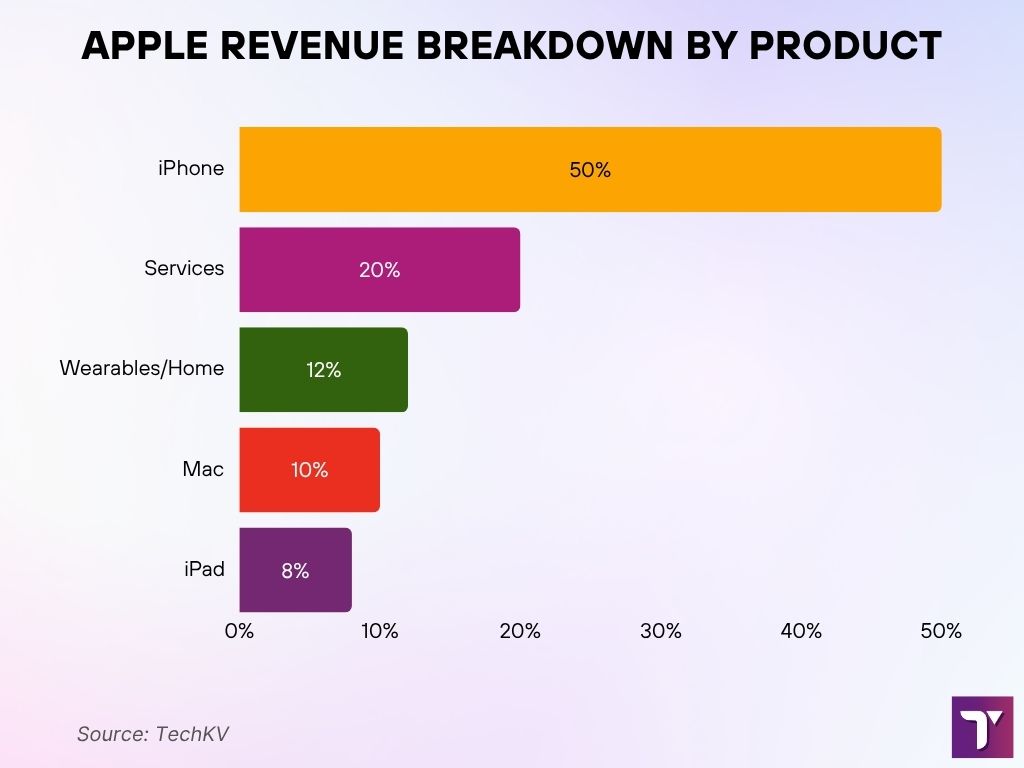
- The iPhone remains Apple’s top earner, contributing a massive 50% of total revenue.
- Services make up 20%, showing Apple’s strong shift toward recurring digital income.
- Wearables/Home products contribute 12%, highlighting growth in Apple Watch, AirPods, and smart home devices.
- The Mac lineup accounts for 10%, sustaining steady demand in the computing segment.
- The iPad delivers 8% of revenue, reflecting a smaller but consistent market share.
Popular iPhone App Categories
- Gaming apps have the highest retention, with 46% of users still active after 3 months, driven by immersive content and frequent updates.
- Social media apps retain about 31% of users after 3 months, supported by continuous user interaction and algorithmic feeds.
- Productivity apps hold third place with a 26% retention rate over the same period, thanks to task-driven utility and syncing features.
- Retention during the first few days is highly influenced by in-app engagement and a smooth onboarding experience.
- Long-term retention depends on regular feature rollouts, bug fixes, and personalized updates to maintain user interest.
Impact of New iOS Updates on iPhone App Retention
- Apps with regular updates have a retention rate of 49%, compared to 32% for apps with infrequent updates.
- Personalized app experiences boost retention by up to 18%, as users build a stronger connection with tailored content.
- An active feedback loop increases app retention by nearly 22%, thanks to user-driven improvements and quick issue resolution.
- Subscription-based apps retain about 42% of users after 90 days, compared to 28% for one-time purchase apps.
- Cross-platform apps with sync features see a retention boost of 20%, as users prefer seamless access across devices.
iPhone vs Android Users Overview
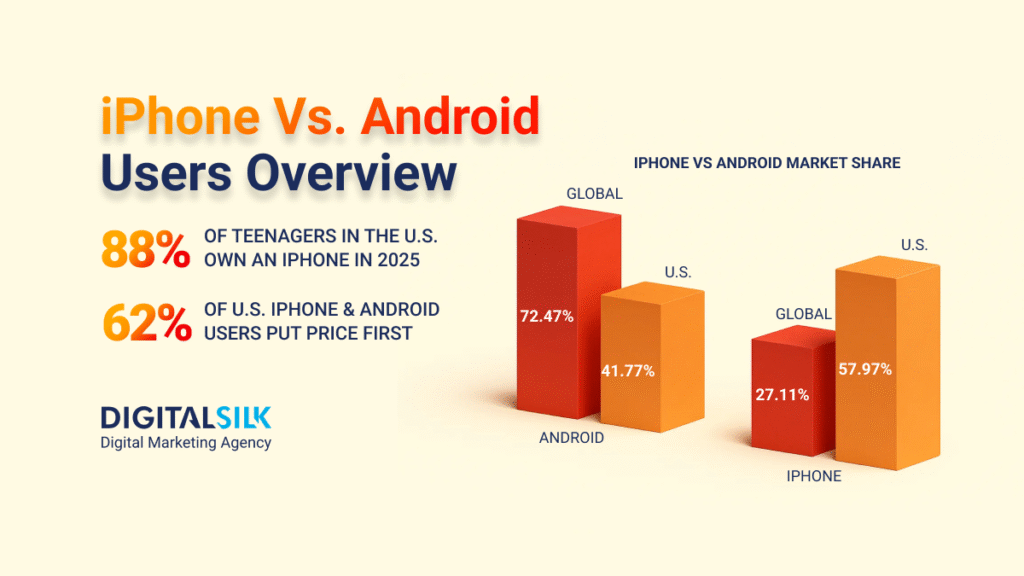
- 88% of teenagers in the U.S. own an iPhone, showing Apple’s dominance among Gen Z users.
- 62% of U.S. smartphone users prioritize price when choosing between iPhone and Android.
- Globally, Android leads the market with a 72.47% share, while iPhone holds only 27.11%.
- In the U.S., iPhone dominates with a 57.97% share, compared to Android’s 41.77%.
Age Distribution of iPhone Users
- The largest user base remains the 18 to 24 age group at 34%, driven by strong app usage and digital lifestyle preferences.
- The 25 to 34 age group accounts for 27% of iPhone users, showing stable adoption among young professionals.
- Usage among the 35 to 44 age group stands at 21%, reflecting moderate engagement in mid-life demographics.
- Only 13% of users are above 44 years old, although this segment has grown slightly due to accessibility features.
- All age groups have seen a 2% to 3% increase in adoption, indicating broader market penetration.
Income Levels of iPhone Users
- 40% of iPhone users now earn over $100,000 annually, up from 35% in previous years.
- 27% of the user base earns between $50,000 and $100,000 per year, showing strong mid-income adoption.
- About 18% of users make less than $50,000 per year but still own an iPhone, often through trade-ins or financing.
- Lower-middle income users, earning $30,000 to $50,000, represent around 13% of the iPhone user base in 2025.
- The lowest income group, earning under $30,000 annually, accounts for 7% of total iPhone users.
- Brand loyalty is highest among high-income users due to easier access to upgrades and Apple’s full ecosystem.
- Financing plans and trade-in programs continue to support iPhone adoption among lower-income demographics globally.
iPhone vs Android Market Share by Country
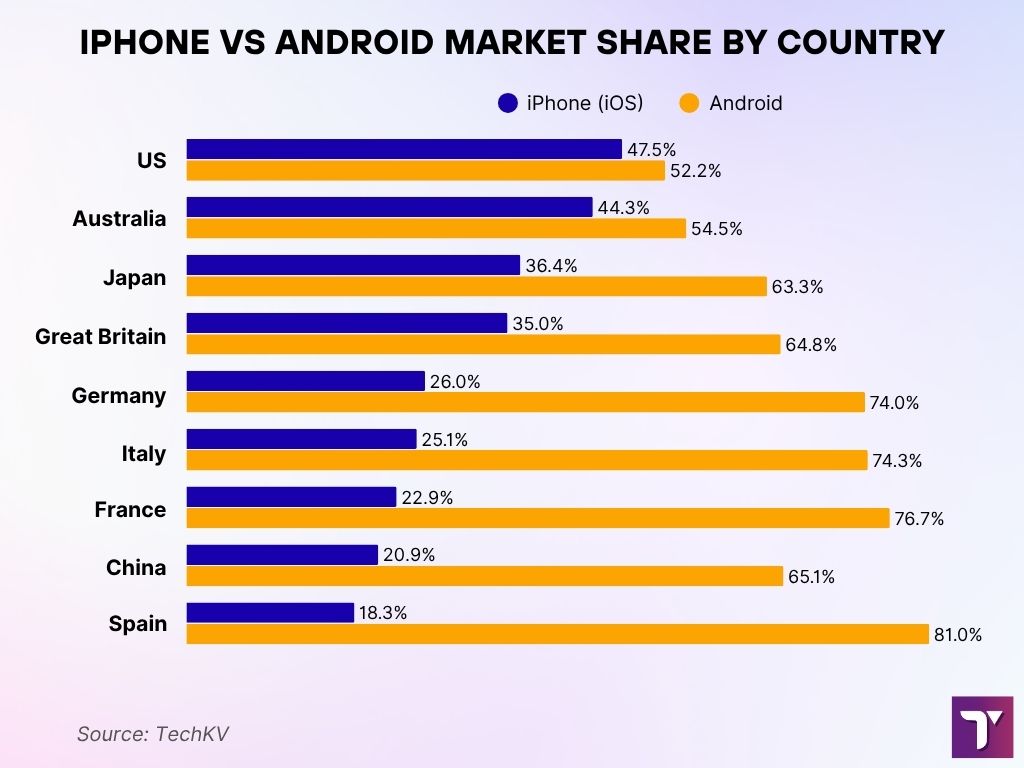
- In the US, iPhone holds 47.5%, while Android leads with 52.2% of the market.
- Australia shows a similar pattern with 44.3% using iPhones and 54.5% on Android.
- Japan has 36.4% iPhone users, compared to 63.3% on Android.
- In Great Britain, iPhone captures 35%, while Android holds 64.8%.
- Germany reports only a 26% iPhone share, with Android dominating at 74%.
- In Italy, 25.1% use iPhones and 74.3% are on Android.
- France sees a low 22.9% iPhone share versus 76.7% Android usage.
- In China, iPhone accounts for 20.9%, while Android leads with 65.1%.
- Spain has the lowest iPhone adoption at 18.3%, with Android at a strong 81%.
Educational Background of iPhone Users
- Around 26% of iPhone users worldwide hold an advanced degree such as a Master’s, PhD, or MD.
- 44% of users have completed a bachelor’s degree, making it the most common education level among iPhone owners.
- Approximately 21% of iPhone users have some college education without completing a degree.
- Nearly 9% of users have a high school diploma or lower, often from rural areas or developing regions.
- Users with higher education typically use iPhones for productivity, work-related tasks, and digital learning apps.
- There is a strong correlation between higher education and iPhone ownership, driven by better income and urban residency.
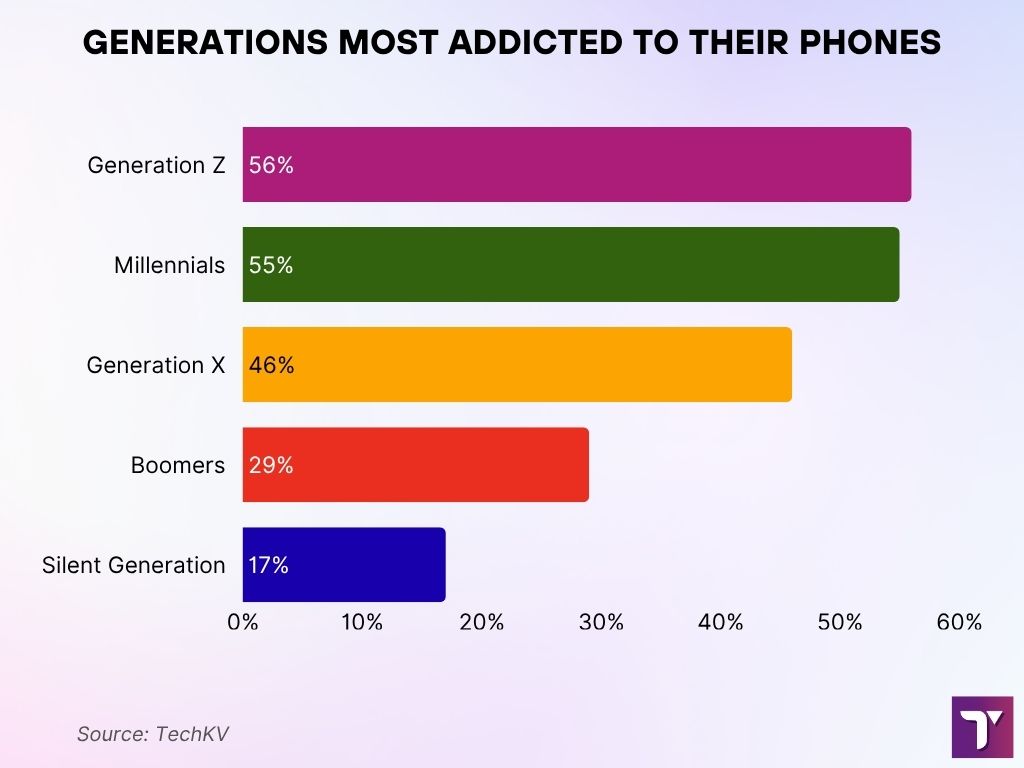
Generations Most Addicted to Their Phones
- Generation Z tops the list with 56% admitting to high phone dependency.
- Millennials follow closely at 55%, reflecting near-equal digital attachment.
- Generation X shows a noticeable drop, with 46% reporting phone overuse.
- Boomers are less affected, with only 29% claiming phone addiction.
- The Silent Generation has the lowest rate at just 17%, showing minimal reliance on mobile devices.
Trends and Insights
- 5G adoption has now reached 78% among iPhone users, reflecting widespread network support and faster device upgrades.
- AR and VR app usage has grown by 33% year-over-year, boosted by Apple’s push into spatial computing and Vision Pro integration.
- Security and privacy features remain a top driver, contributing to 41% of Android-to-iOS conversions in 2025.
- Apple subscriptions like TV+, Music, and Fitness+ saw a 28% increase in adoption, generating over $40 billion in annual service revenue.
- iOS 26’s new “Liquid Glass” design brings translucent, dynamic UI elements system-wide, as seen in developer beta 4.
- AI-powered notification summaries for news apps are reintroduced in iOS 26 beta 4 with clearer disclaimers and opt-in categories.
- CarPlay now supports video playback via AirPlay, usable when parked, and depending on automaker support.
- Visual Intelligence in iOS 26 enhances screenshot functionality, including Image Search, Add-to-Calendar, and HDR screenshots.
- The public beta of iOS 26 launched mid-July, ahead of the full release expected in September alongside iPhone 17.
Conclusion
I hope these statistics have given you an overview of how iPhone usage is growing within the smartphone market.
While these insights are varied depending on the region and demographics, one can confidently say that the adoption rate of iPhone usage will only double or triple in the coming years.
5 Comments
Can I use a Japan iPhone variant in my country?
Absolutely, you can use a Japan iPhone variant in your country, but keep in mind it has region-specific features like the always-on camera shutter sound. Just double-check that it’s compatible with your local carrier’s network.