The truth of 2024 is that iPhones and Android smartphones dominate the market. With each trying to take over the market and retain more customers, a battle is going on. But have you wondered how different Android and iPhone users are? Well, if you have, you will get some insights from the iPhone vs Android user statistics from 2024, which we have covered below.

    iPhone vs. Android Global and Regional Smartphone Market Share

    Market share is a reliable metric to understand the market penetration of each platform. Here are the latest numbers on the global smartphone market share.

    Apple vs Android Global Market Share

    • As of 2024, the global market share of iPhone is 28.32%. This number consists of a variety of iPhone models running multiple versions of iOS.
    • On the other hand, Android’s market share is at a whopping 70.93%, making it the dominating smartphone entity.
    • Ten years back, in 2014, iOS had a market share of 23.95%, which means that iPhones have retained most users but have not managed to convert more.
    • On the other hand, the global share of Android in 2014 was 53.65%. Considering the difference alone, it is clear that Android smartphones have taken the market by storm. It also benefitted from the big downfall of SymbianOS and Windows Phone.
    • Things become interesting when we consider the market share numbers from 2009. In 2009, iOS had a market share of 34.01%, whereas Android was at a feeble start of 2.41%.
    Apple vs Android Global Market Share

    Apple vs Android Market Share in North America

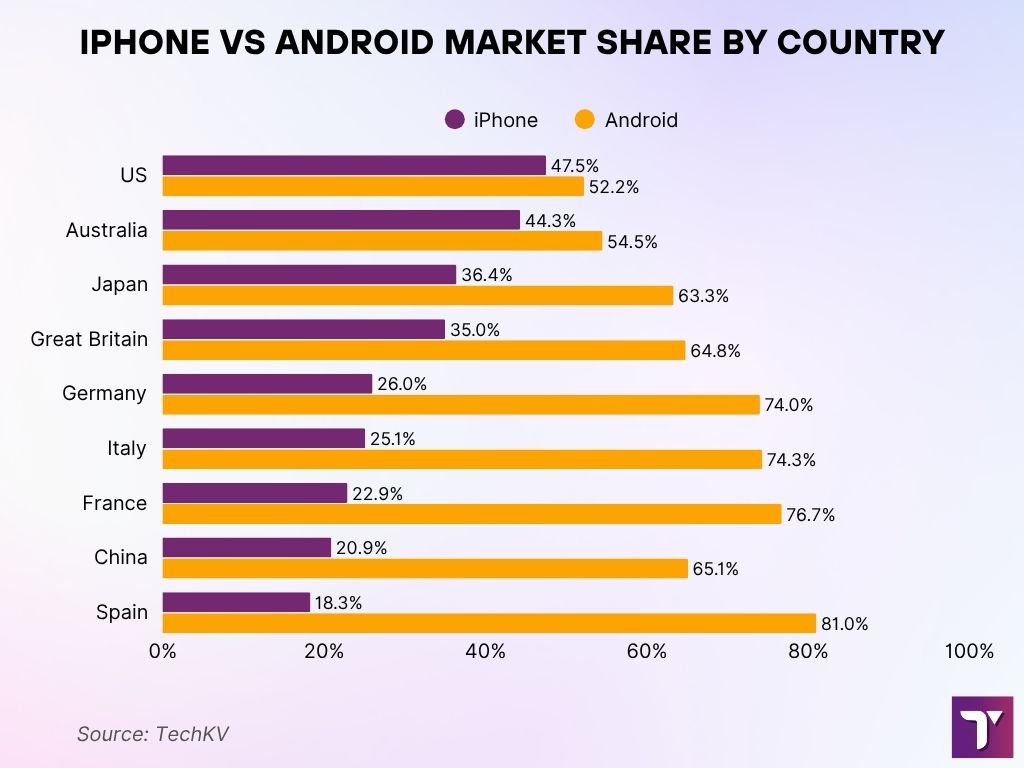
    • North America is a space that has shown different trends than global ones for iPhone vs Android. As opposed to international trends, the iPhone has remained the dominant mobile platform in the US. As of February 2024, the iPhone has a market share of 60.77%.
    • On the other hand, Android’s market share in the United States is only 38.81%, quite different from its percentages in other countries and continents.
    • The closest Android has come closer to equally hitting iOS was in 2015. In this year, Android had an average market share of 46.42%, whereas iOS topped at 50.85%.
    • Since then, the popularity of iPhones has only increased in the United States. It quickly crossed 54% in 2018 and hit the 60% milestone in the first months of 2024.
    • Converting these percentages to numbers means that there are over 133.4 million Android users in the United States, with more people owning an iPhone.
    Apple vs Android Market Share in North America

    Apple vs Android Market Share in Europe

    • The relative popularity of Apple and Android smartphones in the European continent is closer to the global trends. Android has a market share of 66%, whereas iPhones have 34%.
    • These numbers remain the same even when we go to specific countries like Germany or France. In Germany, Android has a user base of 59.79%, whereas the number is 37.67% for iPhones.
    • On the other hand, France shows an even better popularity of Android devices, with a market share of 63.94%, whereas the iPhone is struggling at 35.49%.
    • Even though European countries have favored Android devices over iPhones in the past years, these markets now show a positive trend toward Apple smartphones.
    • Privacy-centric features from the Apple ecosystem have been a key driving factor in this increasing attention that iOS/iPadOS devices have been receiving in Europe.
    Apple vs Android Market Share in Europe

    Apple vs Android Market Share in Asia-Pacific

    • Statistics from 2024 indicate the continuing dominance of Android in the Asian subcontinent. Android smartphones have a market share of 79.46% on average.
    • Even though the situation has improved, iPhones only have a market share of 19.81%. However, there are some variations when it comes to regional spaces within Asia.
    • In China, for instance, iPhones have a relatively higher market share of 24%, pushing Android down to 75%; other platforms, including Huawei and Honor, occupy the rest.
    • In Japan, however, things are a bit more interesting, considering the iPhone market share of 58.85%. This means that Android has been pushed back to 40.93%. Japan is one of the few Asian spaces where you can find iPhone dominance.
    • In India, on the contrary, the iPhone remains the minority in terms of market share. As of 2024, iPhones have a market share of only 3.9%, whereas Android smartphones take up 95%.
    Apple vs Android Market Share in Asia-Pacific

    Apple vs Android Market Share in South America

    • The popularity statistics of Android and iPhones from South America are similar to the trends we observe globally.
    • As of 2024, Android has the upper hand with 84% of the market share. On the other hand, iPhone accounts for only 16% of users in the market.
    • The reasons for this trend are manifold, such as the financial status of the demographics and the availability of different options. That is, because iPhones are in the premium segments and there are only a few options to choose from, people tend to go for their Android counterparts.
    • However, when we consider the market share within the premium segment of smartphones, iPhones will have a better representation.
    • Unlike other continents, specific countries within South America also reflect the status. For instance, Brazil has Android with 88% of the market share, whereas the iPhone has only 12%. Similarly, Argentina offers the upper hand for Android with 85% market share, and the iPhone has roughly 15%. In Peru, it will be 86% and 14%, respectively, and 87% and 13%, respectively, in Colombia.
    Apple vs Android Market Share in South America
    See Also
    Mobile Application Revenue Statistics 2024

    User Demographics: iPhone vs Android Statistics

    There are differences between those who use Android and iOS within the market. The criteria include age demographics, gender demographics, income, and educational status of the user base. We will have a brief look at these points.

    iPhone Users vs Android Users: Age Demographics

    • Global trends within the age demographics reveal some interesting statistics about how Gen Z and Millennials have different user experiences/expectations from devices. 31% of Gen Z tend to favor the iPhone over Android, which still has the upper hand.
    • However, once we go to the millennial sections who were born between 1981 and 1996, 35% of the user base prefers iPhone devices to Android. Within the Gen X and Baby Boomers category, Android has the upper hand with 60% and 55% market share, respectively.
    • In the United States, the iPhone seems to be more popular among young adults and adults ages 18 to 34. Out of these, 58% prefer an iPhone to Android, which has only 41% of popularity.
    • However, as we go to the older demographics between 35 and 54, Android has the upper hand, with 53% per unit over iPhone.
    • Even when we go past 55+, there is a trend where Android has a slight upper hand of 51% over the iPhone, which kind of lags behind at 49%.
    iPhone Users vs Android Users_ Age Demographics

    iPhone Users vs Android Users: Gender Demographics

    • Among female smartphone users, 31% tend to go for iPhones over Android. These global trends mean that 54% of the female user base prefers Android smartphones.
    • The customization options on Android are counted as one primary reason for the choice, while affordability and versatility options remain others.
    • Among male users, Android has the upper hand, with a market share of 60%. This puts the iPhone back to a meager 28%.
    • Once again, the versatility of options within Android smartphones is a driving factor for this trend.
    • It must also be noted that more male users spend their time using the advanced features on Android.
    iPhone Users vs Android Users Gender Demographics

    iPhone Users vs Android Users: Income and Education Levels

    • As one can assume from the pricing structures of the iPhone, most iPhone users have a higher income than Android users.
    • On average, the income of a typical iPhone user is close to $53,251. At the same time, Android users have an average yearly income of $37,040.
    • This trend remains the same when we consider educational status as well. iPhone users tend to have higher educational status, with most of them having a graduate degree or advanced diplomas.
    • On the other hand, the Android user base accommodates people with varying levels of education. It consists of people with advanced skills as well as those who have not completed high school.
    • These differences are evident across the urban-rural divide as well. iPhones have a better hold over users residing in urban areas, but Android has balanced popularity in urban and rural areas alike.

    User Behavior and Preferences of Android vs. iPhone

    Here are some numbers on user preferences and behavior on Android and iPhone devices. We shall also talk about brand loyalty here.

    Brand Loyalty and Device Retention on iPhone vs. Android

    • In terms of brand loyalty and device retention, both Android and iOS have been great. The average iPhone retention rate is 85-88%, meaning that people who shift to iPhone from Android rarely go back.
    • However, Android also has an impressive retention rate of 89-91%, which means that it is difficult to convert a long-time Android user into an iPhone user.
    • This trend becomes clear when we consider the users who have switched between these operating systems. Only 18% of iPhone users have used an Android before, whereas only 11% of Android users have used an Apple device before.
    • For an average of 47% of former Android users, the shift to the iPhone has been significant, primarily due to the ease of use.
    • For an average of 29% of former iPhone users, the shift was due to budgetary constraints, and they could find more affordable devices running Android.
    Brand Loyalty and Device Retention on iPhone vs Android

    Device Usage Patterns: iPhone Users vs Android Users

    • An average iPhone user spends close to 5 hours of screen time per day. Most of this is spent on text messages and selfies, which is a common reason for many people to get an iPhone.
    • For Android users, the time is low, with only a screen time of 3 hours and 42 minutes on average. Even though Android users also spend a lot of time on text messages, they tend to take fewer selfie images.

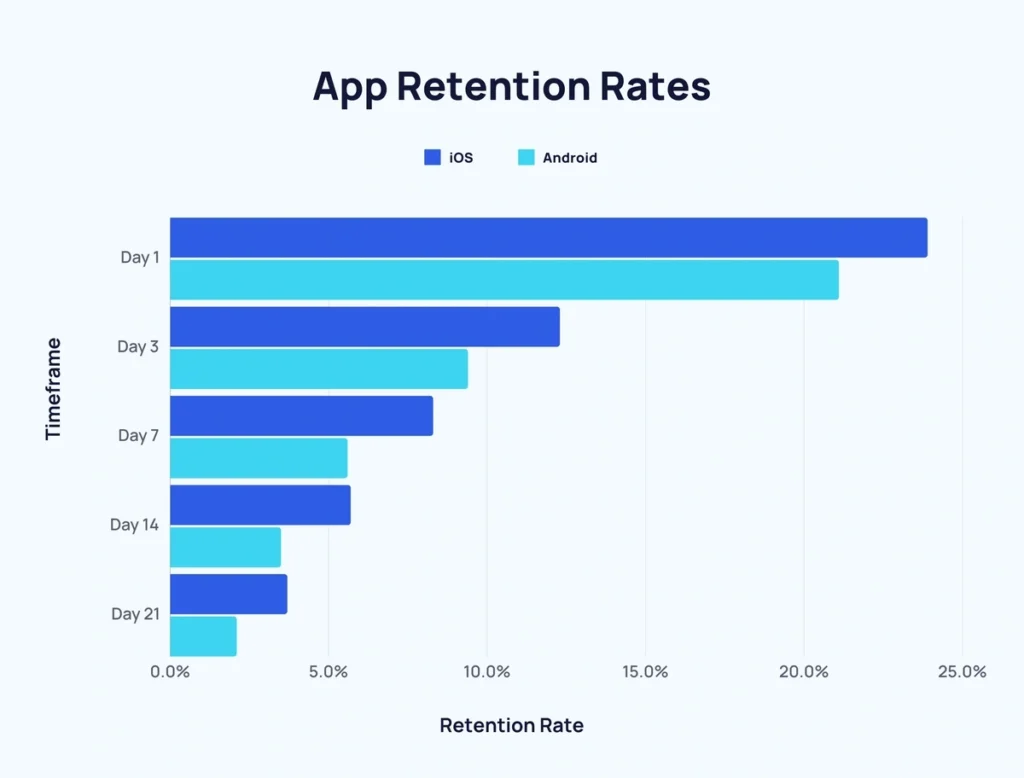
    App Retention and Engagement: iPhone Users vs Android Users

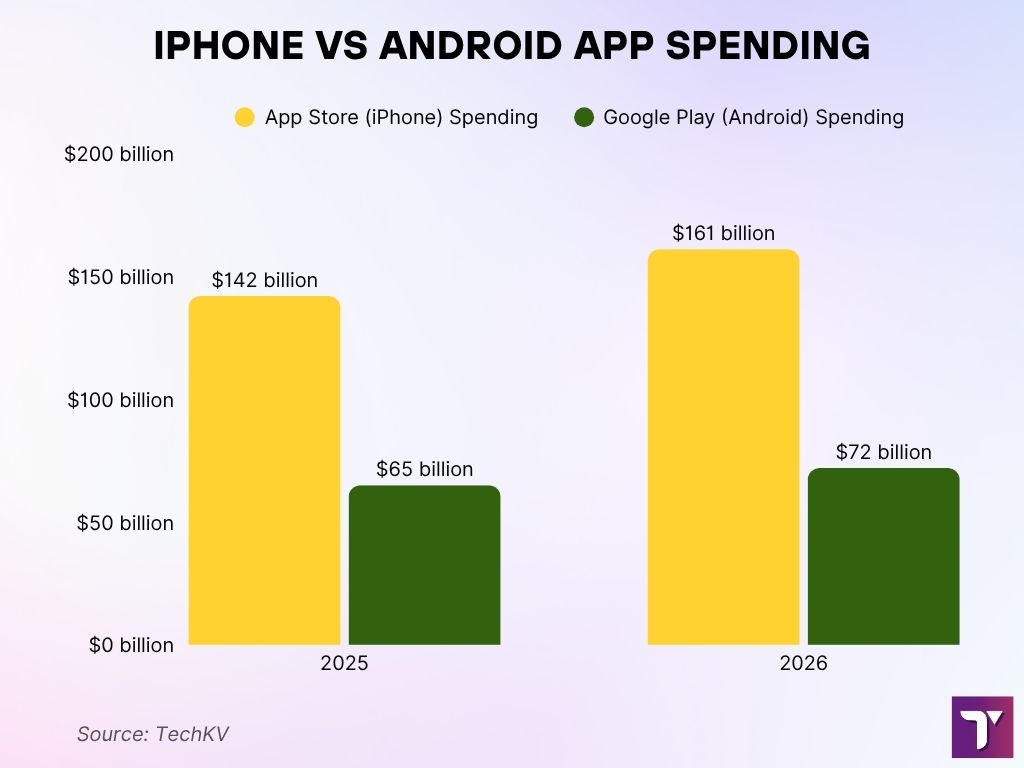
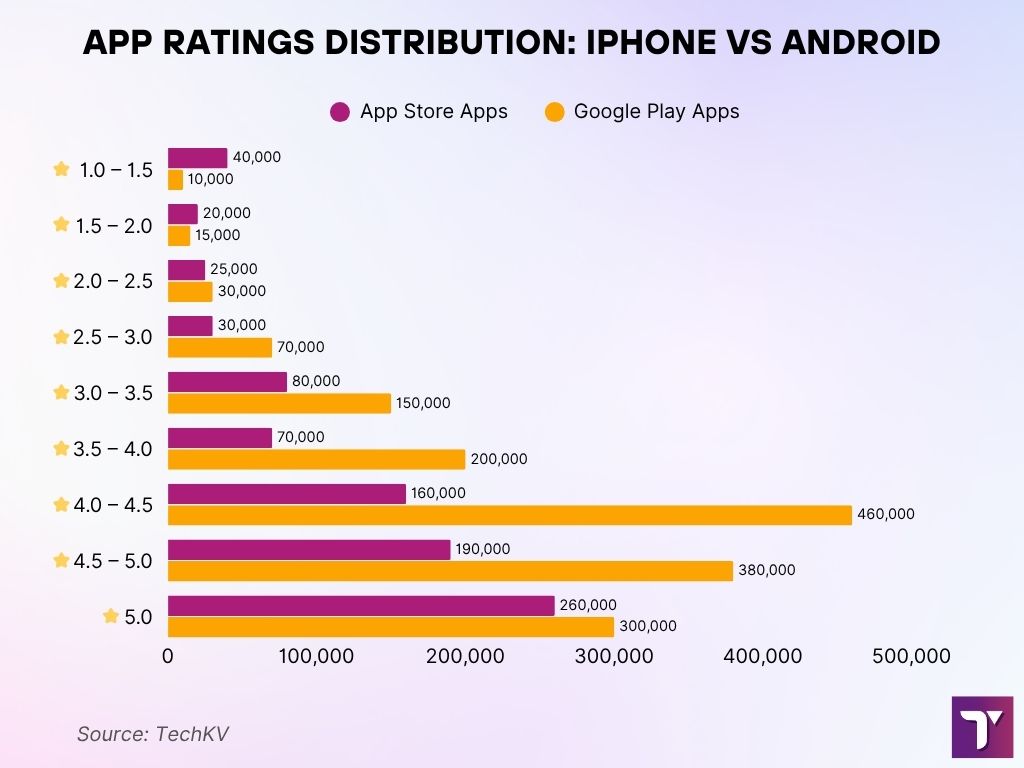
    • iPhone users focus most of their spending on in-app purchases and premium applications. The records also show that iPhone users are more likely to purchase a premium subscription compared to Android users.
    • Trends also indicate that iPhone users prefer paid apps instead of ad-supported ones. This is reflected in the app-spending patterns within the App Store.
    • Partly thanks to the diversity within applications, Android users rely more on ad-supported ones than making premium purchases.

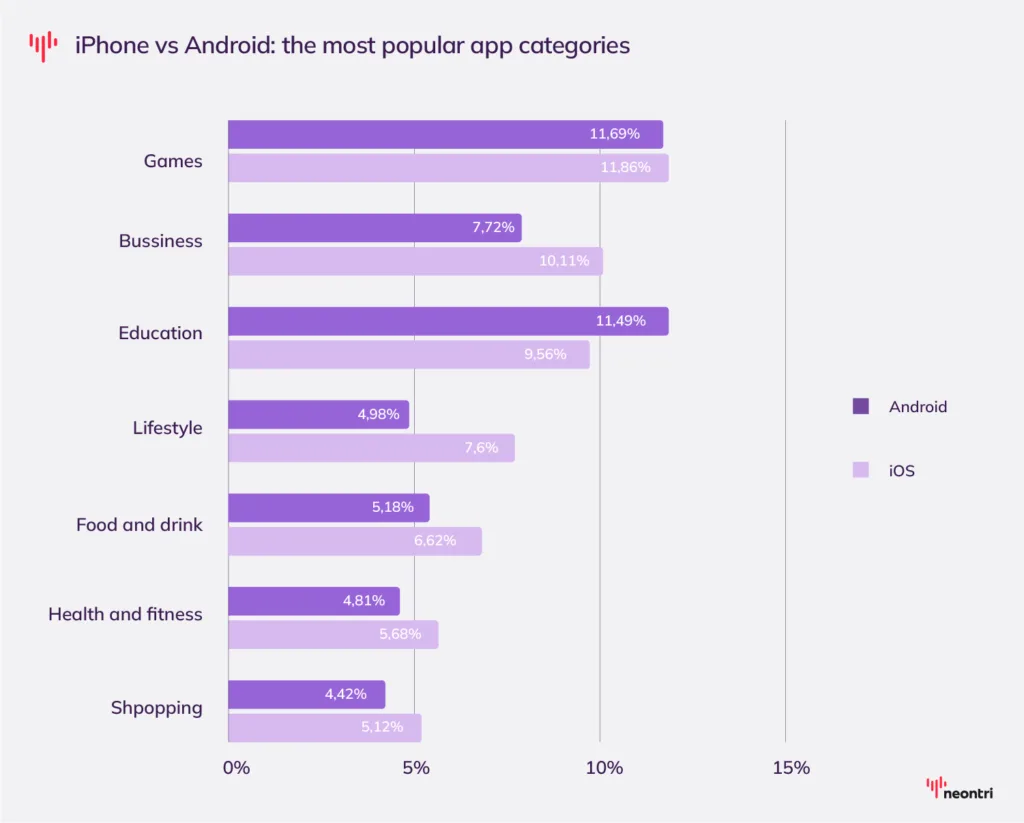
    Usage Metrics within Android and iPhone

    • iPhone users are relatively more confident about the security features built into iOS and other associated services. As a result, they heavily rely on Apple iCloud Keychain, which is the built-in password management system across Apple devices.
    • Due to the built-in features on iOS, iPhone users are also more concerned about which applications have access to specific permissions and location tracking. The option to stop particular applications from tracking the user is also a popular feature among iPhone users.
    • On the other hand, Android users are pretty confident, but they tend to use third-party services to improve the overall security and privacy within the smartphone experience. Most Android users also recommend the platform for its ability to support various security options.
    • The average data consumption on iPhone devices is higher than that of Android, chiefly due to higher engagement with online services and Apple’s synchronization options.
    • According to statistics from Snapchat and Instagram, iPhone users spend more time on these social media platforms than Android users.
    See Also
    Mobile Games Statistics That Will Blow Your Mind in 2024

    Conclusion

    As you can see, a surface-level comparison between iPhone and Android user statistics in 2024 reveals more insights about the mobile user experience in general. Our coverage also includes region-specific stats that are useful for advanced researchers. You might want to count on these details and further research if you want to invest in one of these markets or make an informed decision.
    Sources

    Share.
    Avatar for Rajesh Namase

    Rajesh Namase is one of the top tech bloggers and one of the first people to turn digital marketing and blogging into a full-time profession. He has unwavering passion for technology, digital marketing, and SEO. With a penchant for exploring the digital world, Rajesh covers a wide range of topics, from Android to the intricate universe of the internet, including WiFi, YouTube, and more.

    1 Comment

    1. Avatar for Theresa Merry

      Great stats! It’s fun to see how iPhone and Android users compare. I like both for different reasons—iPhones for how well EVERYTHING works together and Androids for the customization.

    Leave A Reply