For most people, smartphones have become a platform for running the various apps they need for their daily lives. Of course, the core aspects of a phone still matter, but perhaps a bit less in comparison. Therefore, it is no surprise that mobile applications have become an enormous industry, generating impressive revenue across all categories.
Today, we will look at some of the top mobile application revenue statistics for 2025.
Key Contextual Points
- Global internet users have surged to over 5.45 billion in 2025, driving economic growth in countries like India, China, and Brazil.
- Over 80% of users now prefer internet-based services like messaging apps and VoIP over traditional SMS and calls.
- Smartphone shipments exceeded 1.38 billion units globally in 2025, powered by affordable pricing and cheap data plans.
- Mobile gaming revenue is projected to hit $111 billion in 2025, as free-to-play models and aggressive marketing drive massive download volumes.
- Pandemic-driven app habits have persisted, with entertainment and social media apps now used by more than 95% of smartphone owners.
- Smartphone users worldwide have reached 6.92 billion in 2025, cementing mobile as the dominant tech platform.
- Americans now check their smartphones an average of 144 times per day, up from previous years.
- By 2027, the number of smartphone users is forecast to reach over 7.76 billion, according to the latest estimates.
- Nearly 91% of millennials rely on smartphones throughout the day as their primary device.
- Mobile devices dominate usage, accounting for over 58.6% of global web traffic in 2025, outpacing desktops and tablets.
Mobile App Market Growth Outlook
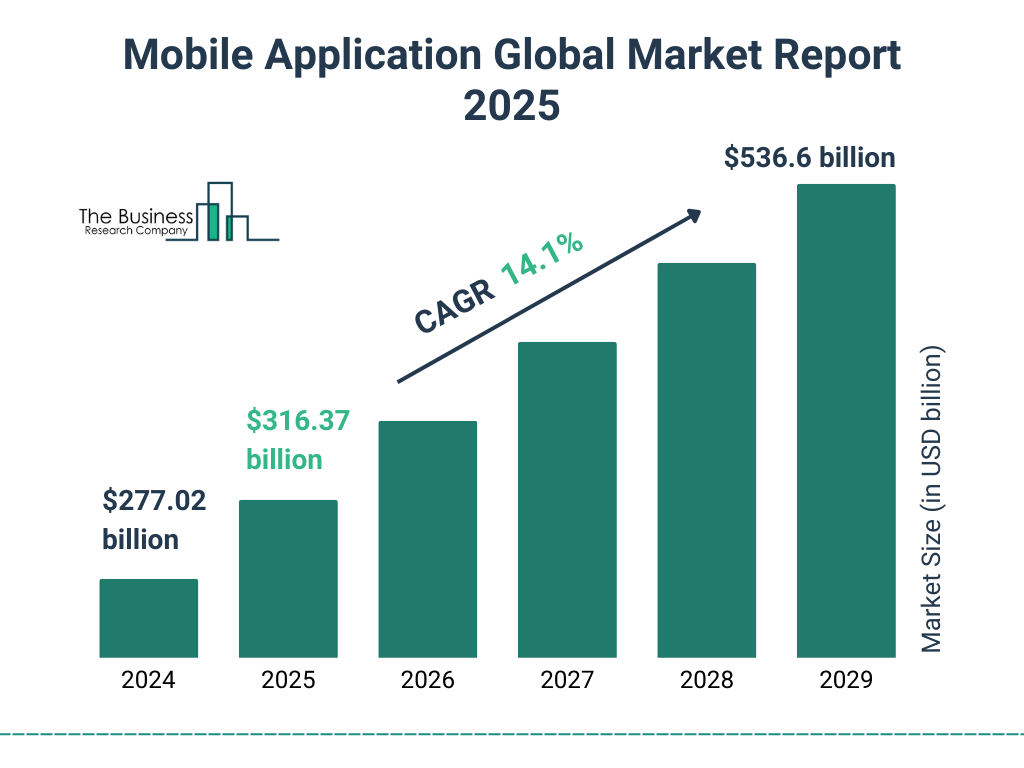
- The global mobile app market is projected to reach $316.37 billion in 2025.
- The market is expanding at a CAGR of 14.1%, signaling strong demand and continuous innovation.
- By 2026, the market size is expected to grow even further beyond $316.37 billion.
- The forecast continues upward to $536.6 billion by 2029, nearly doubling the 2025 value.
- This surge highlights increasing reliance on smartphones, mobile-first services, and app-based revenue models globally.

Mobile In-App Spending
- In-app purchases now generate over $174 billion in 2025, remaining the second-largest revenue source after mobile app advertising.
- Subscription-based revenue has risen sharply, accounting for 43% of total in-app spending across both iOS and Android ecosystems.
- Advertising revenue still leads, driven by regional targeting and growing usage in emerging markets like Southeast Asia and Africa.
- Tinder continues to dominate the Apple App Store in earnings, with over $45 million in monthly in-app revenue from premium subscriptions.
- Only 5.1% of non-gaming apps convert downloads into subscriptions, with roughly 51 users per 1,000 opting for paid plans.
- The Apple App Store now has more than 1.72 million apps priced under $1.00, reflecting developers’ freemium strategy.
- There are 310+ paid apps on the App Store priced between $9 and $10, mostly in the productivity and professional tool categories.
- The Google Play Store now features over 41,000 apps costing less than $1, with around 2,450 apps priced in the $9 to $10 range.
- Android users can choose from over 28,000 apps priced between $1 and $2, emphasizing mid-range pricing flexibility.
- In 2025, the Apple App Store hosts 4.2 million apps and over 1.2 million games, up dramatically from 2013’s figures.
- US app publishers in 2025 prefer in-app billing and paid apps over ads, with 39% of revenue coming from non-ad models.
Most Used Social Media Platforms Worldwide
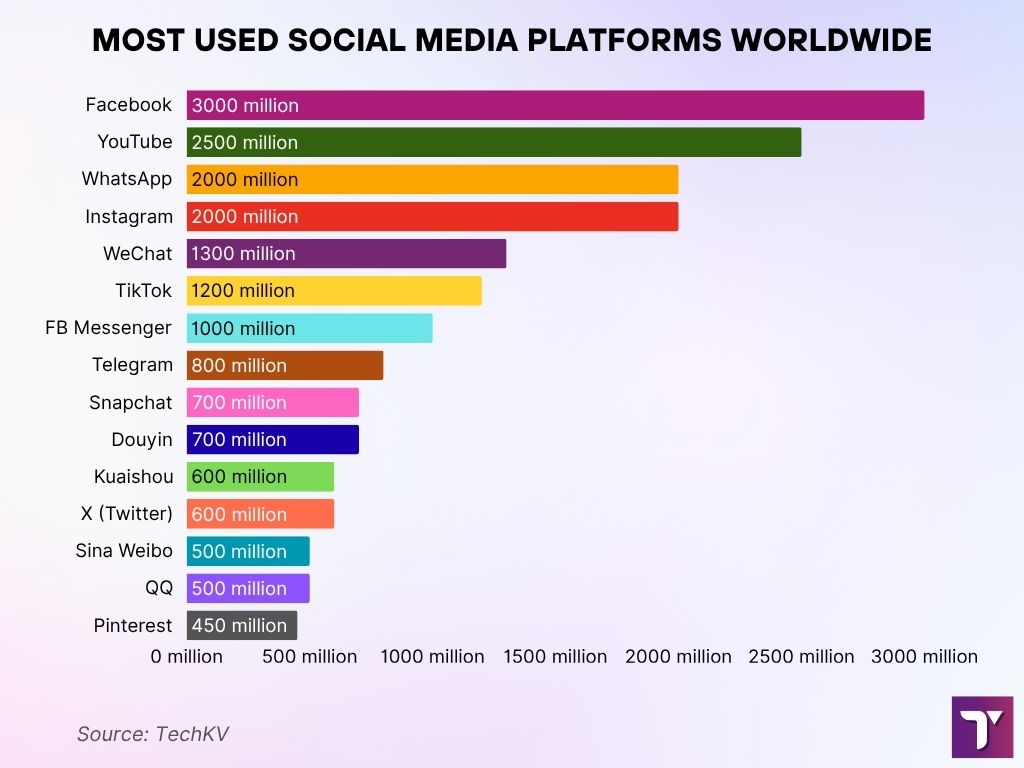
- Facebook leads globally with 3 billion active users, making it the most dominant social platform.
- YouTube follows closely with 2.5 billion active users, driven by video consumption trends.
- Both WhatsApp and Instagram boast 2 billion users each, reflecting Meta’s continued influence.
- WeChat has around 1.3 billion active users, showcasing China’s strong local platform presence.
- TikTok continues its rise with 1.2 billion users, popular among Gen Z and younger millennials.
- Facebook Messenger still maintains a solid base with 1 billion active users.
- Telegram has reached 800 million users, growing steadily as a privacy-focused messaging app.
- Snapchat and Douyin (China’s version of TikTok) each report 700 million active users.
- Kuaishou and X (Twitter) have around 600 million users, maintaining a loyal regional and niche audience.
- Sina Weibo and QQ each register about 500 million users.
- Pinterest rounds out the list with 450 million active users, showing its strength in visual discovery.

Top Mobile Application Revenue
- As of June 2025, Douyin remains the top iPhone app by revenue, earning over $414 million through in-app purchases.
- TikTok holds the second spot on iOS with $359 million in revenue, driven by global subscriptions and live gifting features.
- Piccoma, a Japanese manga subscription app, ranks third on iOS with revenue hitting $245 million in 2025.
- Max (formerly HBO Max) is one of the few US-made apps still in the global top 10 by App Store revenue, with $121 million.
- On Android, Disney+ leads in revenue with over $82 million generated in the Google Play Store in 2025.
- TikTok ranks third on Google Play, pulling in $44 million in 2025 from premium features and creator monetization tools.
- Other top-grossing Android apps in 2025 include Google One, Peacock, Crunchyroll, Tinder, and Bumble, each surpassing $25 million in revenue.
- The percentage of free apps on Google Play rose to 97.3% in 2025, reflecting the shift toward freemium models and in-app monetization.
Google Play vs. iOS App Store: App Distribution Breakdown
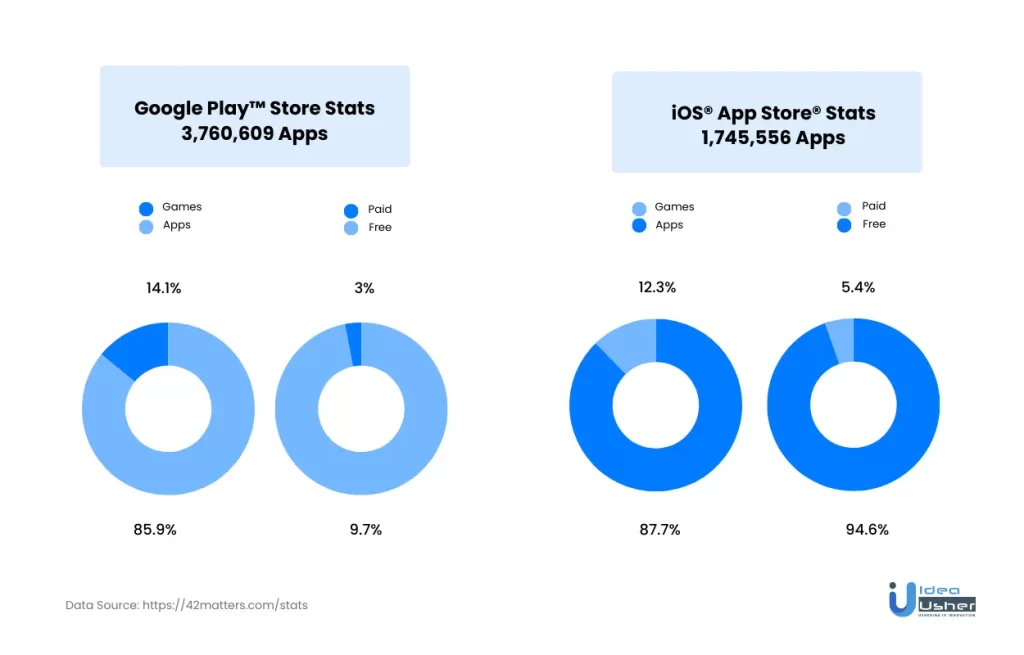
- Google Play hosts 3,760,609 apps, while the iOS App Store features 1,745,556 apps.
- In Google Play, 14.1% are games and 85.9% are other apps.
- For iOS, 12.3% are games, while 87.7% are apps.
- Free apps dominate both stores: 97% on Google Play and 94.6% on the iOS App Store.
- Paid apps are more common on iOS (5.4%) than on Google Play (3%).
- The data highlights that Google Play offers over double the number of apps compared to the iOS App Store, but both platforms heavily favor free and non-gaming apps.

Popular Mobile Application Categories
- As of Q2 2025, the most popular Apple App Store categories are Games, Business, Education, Utilities, and Lifestyle, accounting for over 68% of total downloads.
- Weather and Trivia apps on iOS show the highest conversion rates, averaging around 9.4%, thanks to utility-driven usage.
- Social networking and racing games, though highly downloaded, have low conversion rates at just 2.1% and 1.8% respectively.
- In the US, mobile users spend over 54% of their daily screen time on social media and browsing apps, yet these categories contribute less than 18% of total app revenue.
Leading Activities Among Smartphone Users Worldwide
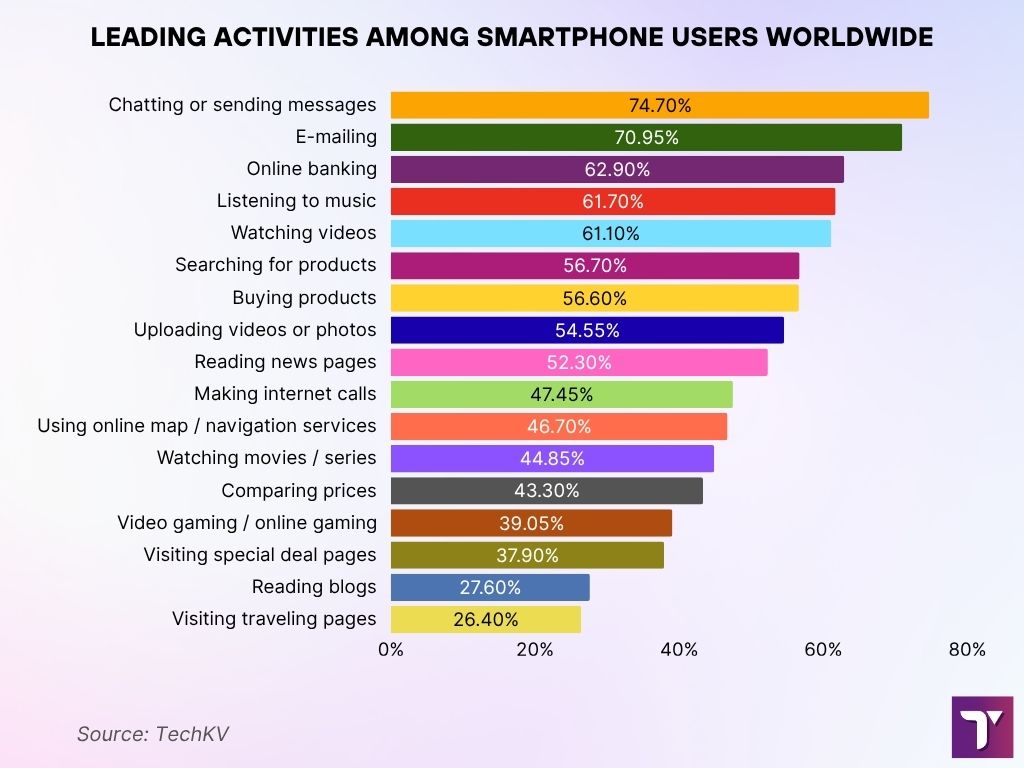
- 74.7% of users engage in chatting or sending messages, making it the most common smartphone activity.
- 70.95% of smartphone users rely on their devices for emailing, blending personal and professional use.
- 62.9% perform online banking, highlighting the growing trust in mobile financial services.
- 61.7% of users listen to music on their phones, turning them into portable entertainment hubs.
- 61.1% enjoy watching videos, reinforcing the dominance of video content on mobile platforms.
- 56.7% search for products, while 56.6% actually proceed to buy products via their smartphones.
- 54.55% upload videos or photos, showing strong user engagement with content creation.
- 52.3% visit news pages, making smartphones a go-to source for current events.
- 47.45% use smartphones for internet calls, leveraging VoIP over traditional calls.
- 46.7% navigate with online maps, underlining smartphones’ utility in daily travel.
- 44.85% watch movies or series, using mobile screens as secondary entertainment platforms.
- 43.3% compare prices while shopping, indicating informed buying behavior.
- 39.05% participate in online gaming, revealing the mobile gaming market’s strength.
- 37.9% explore special deal pages, showing a trend toward mobile deal-hunting.
- 27.6% read blogs, and 26.4% visit travel pages, showing niche but steady interests.

Interesting Numbers on Mobile App Markets
- The average app price on the Apple App Store in 2025 is $0.81, while the average game costs $0.49, bringing the overall average to $0.76.
- From 2019 to 2025, the number of free apps on the App Store increased by 5.7%, now making up over 94.3% of all apps.
- The Amazon Appstore hosts around 502,000 apps in 2025, remaining a niche player compared to Apple and Google.
- The Apple App Store charges a 30% commission for standard in-app purchases and subscriptions, but offers a 15% rate for small businesses under its App Store Small Business Program.
- Google Play also charges 30% on standard purchases, but offers 15% for subscriptions and lower rates for educational and indie apps.
- In 2025, the Apple App Store leads in global consumer spending, capturing 62% of total mobile app revenue compared to Google Play’s 38%.
Conclusion
These statistics and numbers indicate that the mobile application industry is set to become huge in the coming years. Because developers are now integrating all the new AI features and AR options into the apps, the spending on these apps is also expected to rise.

2 Comments
To think that TikTok is available in many countries and DouYin is only in China says how many Chinese there are vs people in many countries. lol
I wonder what the numbers will be for the next 5 years…