It’s not really surprising to know that most of the internet traffic comes from mobile devices. Yet, I wouldn’t have believed this 10 or 15 years back. Sure, mobile devices were becoming popular, but the adoption rates had a sudden jump in the past decade. A quick analysis of statistics on internet traffic from mobile devices is capable of revealing the same impact. In this guide, I have listed some of these stats.
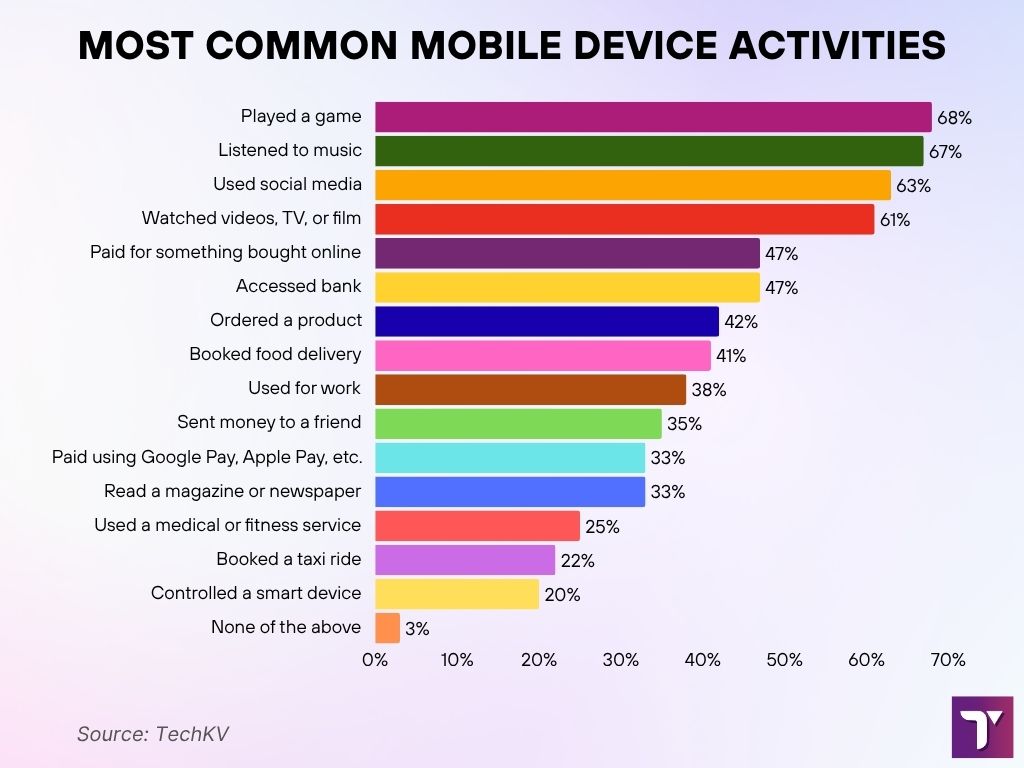
Most Common Mobile Device Activities
- 68% of users played a game on their mobile device, making it the top activity.
- 67% reported they listened to music, showing how audio content dominates mobile usage.
- 63% of respondents used social media apps, emphasizing continued social engagement.
- 61% watched videos, TV, or films on their phones, reflecting the mobile streaming boom.
- 47% made online purchases via mobile, and another 47% accessed banking services, highlighting the shift to mobile finance.
- 42% ordered products online, while 41% booked food delivery, showcasing strong mobile e-commerce usage.
- 38% used their device for work, pointing to the mobile’s growing role in productivity.
- 35% sent money to a friend, indicating peer-to-peer mobile payments are common.
- 33% used digital wallets like Google Pay or Apple Pay, and another 33% read magazines or newspapers, reflecting a mix of financial and content consumption.
- 25% accessed medical or fitness services, showing health-related mobile engagement.
- 22% used their phone to book a taxi ride.
- 20% controlled a smart device using their mobile, supporting the growth of smart home ecosystems.
- Only 3% of users did none of the listed activities, indicating how integral mobile devices are to daily life.
Mobile Device and Internet Usage
- In 2025, mobile devices generate 63.2% of all global website traffic, continuing to outpace desktop use.
- An estimated 5.5 billion people worldwide now access the internet using smartphones and tablets.
- In Africa, mobile remains dominant with 75.1% of users choosing mobile over desktop for internet access.
- The number of global 5G connections has surged past 1.1 billion in 2025, driven by faster infrastructure expansion.
- Mobile traffic has more than tripled since 2014, cementing its role as the primary source of online access.
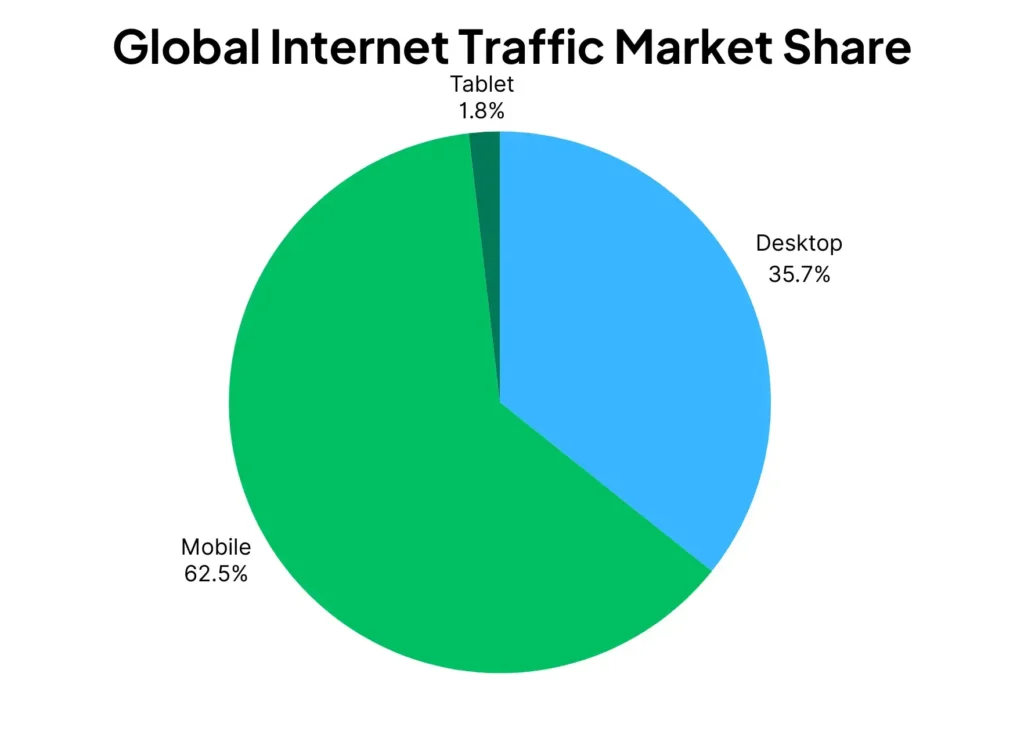
Global Internet Traffic Market Share
- Mobile devices dominate with 62.5% of the global internet traffic, highlighting the shift toward mobile-first browsing.
- Desktop usage accounts for 35.7%, still significant but clearly trailing mobile.
- Tablets make up just 1.8% of global internet traffic, showing limited usage compared to other device types.
How Much Internet Traffic Is From Mobile Devices?
- As of 2025, mobile devices account for approximately 63.2% of all internet traffic globally.
- Back in 2012, mobile traffic was just 10%, showing it has more than tripled over time.
- In India, mobile web traffic now makes up an impressive 81.5% of total internet usage.
- Across Asia, 71% of internet traffic now comes from smartphones and other mobile devices.
- Africa leads all regions, with 75.1% of internet activity generated through mobile connections.
- In the United States, mobile traffic holds a 48.4% share, reflecting continued desktop preference.
- Platforms like YouTube and Instagram see nearly 82% of their usage coming from mobile devices.
- Despite the US having one of the highest smartphone penetration rates, its mobile traffic share remains relatively moderate.
- These figures highlight how affordability and accessibility of mobile tech are fueling digital inclusion in emerging markets.
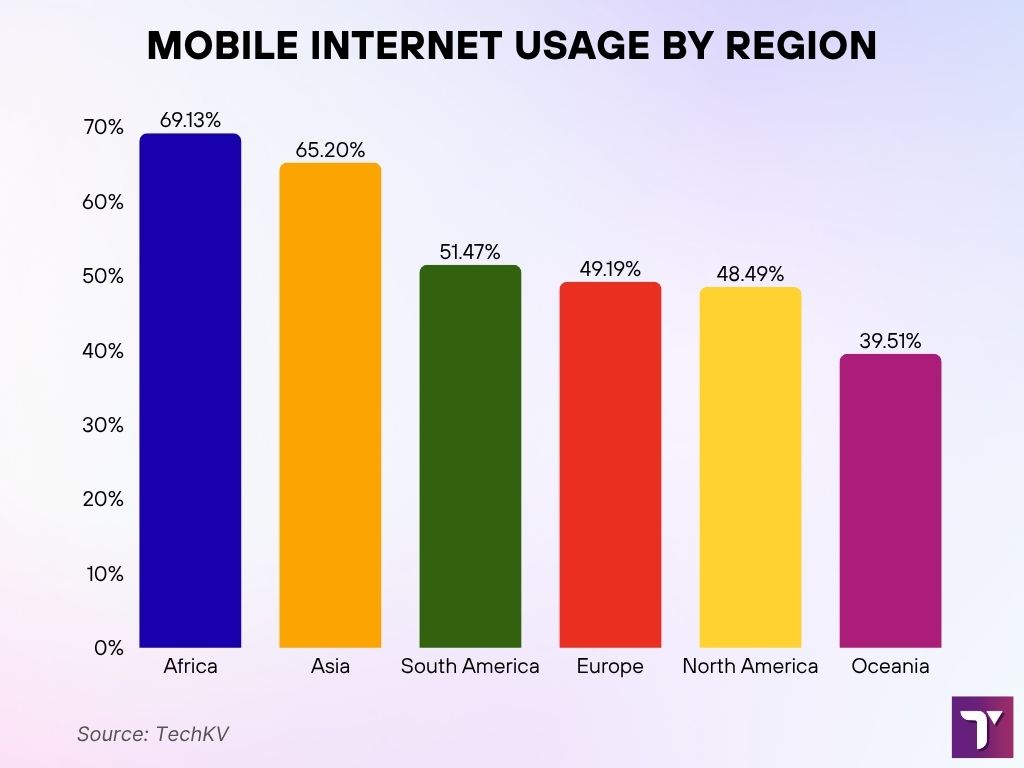
Mobile Internet Usage by Region
- Africa leads with 69.13% mobile internet usage, which is 12.24% above the global average.
- Asia follows with 65.2%, showing strong mobile-first engagement and 8.31% above the global norm.
- South America records 51.47%, which is 5.42% below the global average.
- Europe sees 49.19% mobile traffic, falling 7.7% below the global benchmark.
- North America is slightly lower at 48.49%, or 8.4% below the average.
- Oceania has the lowest share at 39.51%, which is 17.38% under the global average.
These insights highlight how mobile usage dominates in developing regions, especially in Africa and Asia, while desktop remains stronger in wealthier regions like North America and Oceania.
5G Adoption Statistics
- As of 2025, global 5G connections have reached approximately 1.6 billion, with rapid growth across all continents.
- Forecasts now place total 5G connections at 4.8 billion by the end of 2025, up from previous projections.
- China still leads with over 60% of global 5G connections, followed by the United States, India, and Japan.
- South Asia continues to show strong growth in 5G adoption, driven by expanding infrastructure and lower data costs.
- Europe is on track to hit 420 million 5G connections by the end of 2026, with steady rollout progress.
- India is expected to surpass 540 million 5G connections by the end of 2027, making it a top emerging market.
- Latin America will cross 65 million 5G connections by the end of 2025, showing consistent adoption in urban areas.
- Australia’s 5G user base has tripled since 2021, driven by demand for faster speeds and wider coverage.
- In 2025, 5G smartphones account for over 78% of global smartphone shipments.
- Average 5G data usage per user is expected to reach 100GB per month globally by the end of 2025.
- There are now over 250 mobile operators offering 5G in more than 100 countries, reflecting widespread network availability.
- 80% of Europe’s population is projected to have 5G access by the end of 2025, enhancing digital connectivity.
- The U.S. is set to surpass 12,000 active 5G towers by the end of 2025, expanding nationwide coverage.
- India will have around 120,000 5G towers by 2025, significantly boosting rural connectivity.
- Japan is aiming to achieve 90% nationwide 5G coverage by the end of 2025, including remote islands.
- All state capitals in Brazil are expected to maintain full 5G coverage by the end of 2025.
- Saudi Arabia now has over 55% population coverage with 5G as of 2025, leading the MENA region.
- The demand for AR and VR services continues to surge, powered by 5G availability in both consumer and enterprise markets.
- The AR/VR market is projected to grow at a CAGR of 46% from 2025 to 2029, fueled by immersive tech trends.
- Japan plans to invest over 11 trillion Yen by 2030, with the bulk going into advanced 5G infrastructure.
- Governments globally have earned more than $280 billion in 5G spectrum auctions as of 2025.
- By 2030, more than 85 million 5G-enabled IoT devices are expected to be active worldwide.
- The EU is projected to spend close to €55 billion on 5G rollout and infrastructure enhancement.
- 5G’s economic impact is projected to reach $1.35 trillion globally by 2030, driven by innovation and job creation.
- By 2026, there will be over 13 million connected vehicles leveraging 5G for real-time navigation and safety systems.
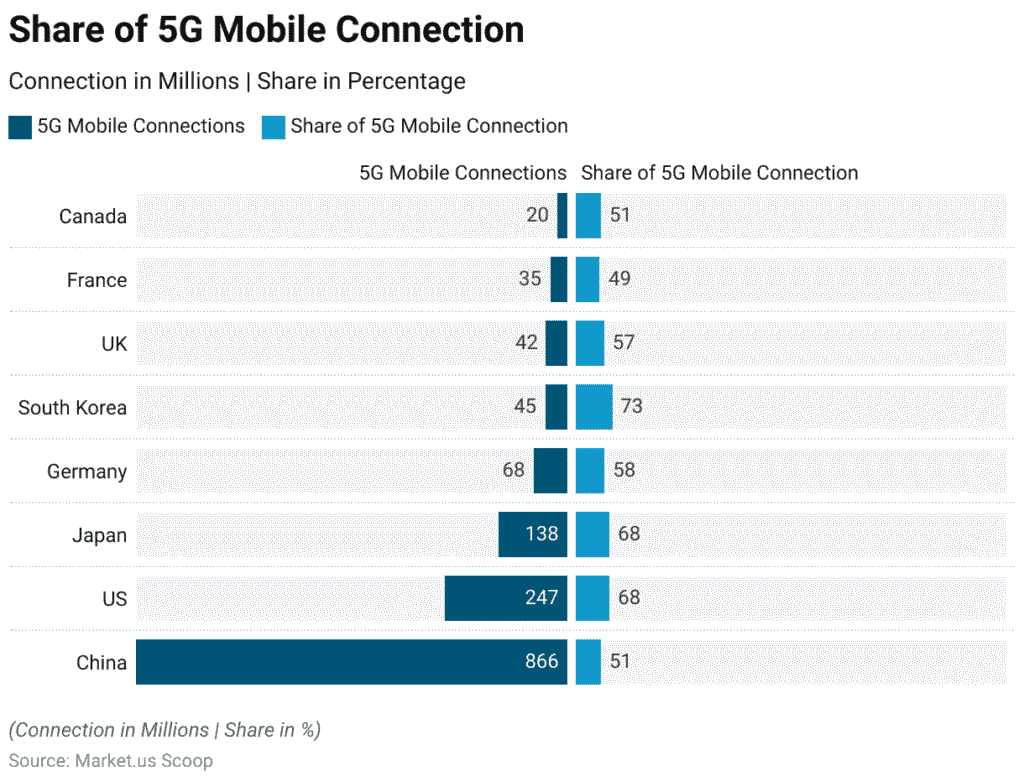
Global Share of 5G Mobile Connections
- China leads with 866 million 5G connections, representing 51% of its mobile network.
- The US has 247 million 5G connections, with a 68% penetration rate.
- Japan follows closely with 138 million connections and a 68% 5G share.
- Germany records 68 million 5G users, covering 58% of its mobile market.
- South Korea stands out with a 73% 5G share from 45 million connections , the highest percentage share among all.
- The UK has 42 million connections with a 57% share.
- France has 35 million 5G users, accounting for 49% of its market.
- Canada registers 20 million connections with a 51% share.
Future of Mobile Internet Usage
- By 2027, the global count of mobile internet users is projected to exceed 7.7 billion.
- Monthly mobile data traffic is expected to hit 390 Exabytes by 2028, marking a 420% increase from 2024 levels.
- As of 2025, around 77% of mobile internet subscribers are based in developing markets.
- By 2030, nearly 90% of the world’s population will have access to mobile broadband.
- The average monthly smartphone data usage will rise to about 52GB by 2027.
- 5G’s low-latency capabilities will continue to fuel growth in AR/VR gaming and immersive apps on mobile devices.
- By 2030, typical mobile download speeds will approach 1.1 Gbps globally.
- Video streaming will account for nearly 72% of all mobile data traffic by 2026, dominating global consumption.
- IoT devices linked via mobile networks will surpass 26 billion by the end of 2030.
- By 2028, approximately 88% of all smartphones will be 5G-capable, reinforcing next-gen connectivity.
Internet Traffic Share by Device Type
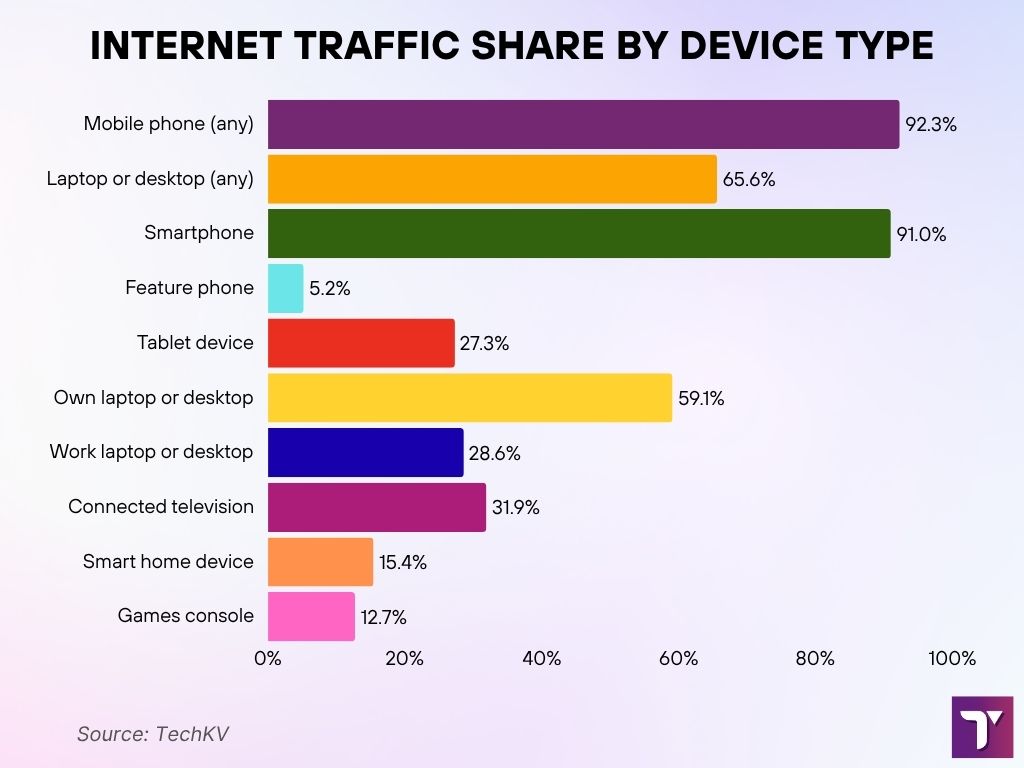
- 92.3% of users access the internet using any mobile phone, making it the most used device category.
- 91% specifically use a smartphone, showing near-universal mobile internet adoption.
- 65.6% access the web via any laptop or desktop, highlighting the enduring relevance of traditional computers.
- 59.1% use their own laptop or desktop for internet browsing.
- 28.6% access the internet through a work laptop or desktop, reflecting workplace connectivity habits.
- 31.9% of users connect via connected televisions, indicating the rise of smart TV usage.
- 27.3% browse the internet on a tablet device, maintaining a modest share.
- 15.4% use smart home devices to connect to the internet.
- 12.7% access the internet via game consoles, underscoring their secondary role in connectivity.
- Only 5.2% use feature phones, showing their limited role in modern internet usage.
Bottom Line
As you have seen, the world of internet-connected mobile devices keeps growing yearly. Although smartphones used to dominate this market, I can sense a noticeable shift towards IoT devices and smart vehicles. All these devices will significantly boost demand due to the rise of 5G connectivity options. In many ways, internet-connected smartphones can also deal with the digital divide, as illustrated by better engagement from developing markets, including but not limited to South Asia.
