Cloud computing has become the backbone of modern IT infrastructure, enabling businesses to scale, innovate, and manage costs efficiently. Cloud adoption is reaching new heights, underpinning technologies like generative AI and real‑time data analytics. In retail, cloud platforms power omnichannel personalization and inventory automation; in healthcare, they support secure patient data exchange and AI diagnostics. Read on to explore the latest statistics shaping the cloud landscape this year.
Editor’s Choice
- 94% of companies globally use some form of cloud computing in their operations.
- In Q2 2025, global enterprise spending on cloud infrastructure services reached $99 billion, rising ~25% year over year.
- AWS, Microsoft, and Google Cloud together hold about 63% of the cloud infrastructure services market in Q2 2025.
- 87% of organizations report a skills gap in cloud computing, particularly in cloud architecture and security.
- By 2025, the world is expected to generate 200 zettabytes of data, much of which will reside in cloud systems.
- SaaS remains the dominant cloud model, with forecasts expecting it to reach $671 billion by 2025.
Recent Developments
- Hyperscalers are increasing capital investment; U.S. hyperscalers are expected to spend nearly $1.2 trillion over three years in cloud infrastructure.
- CoreWeave signed a major contract with OpenAI and deployed cutting‑edge GPU infrastructure in 2025.
- Gartner warns that 25% of cloud efforts by 2028 may trigger “dissatisfaction” due to cost overruns or unmet expectations.
- Cloud migration and multi-cloud adoption increasingly determine enterprise strategy in 2025.
- GenAI workloads are driving extra demand; in Q2 2025, GenAI‑specific cloud services grew by 140%–180% compared to earlier periods.
- Rising complexity in multi-cloud ecosystems is causing management overhead and tool fragmentation.
- Several providers are emphasizing vertical, industry‑specific clouds (e.g., healthcare, automotive) to differentiate.
- FinOps (cloud financial operations) and cost governance tools are increasingly central to managing runaway cloud expenses.
Global Cloud Computing Market Outlook
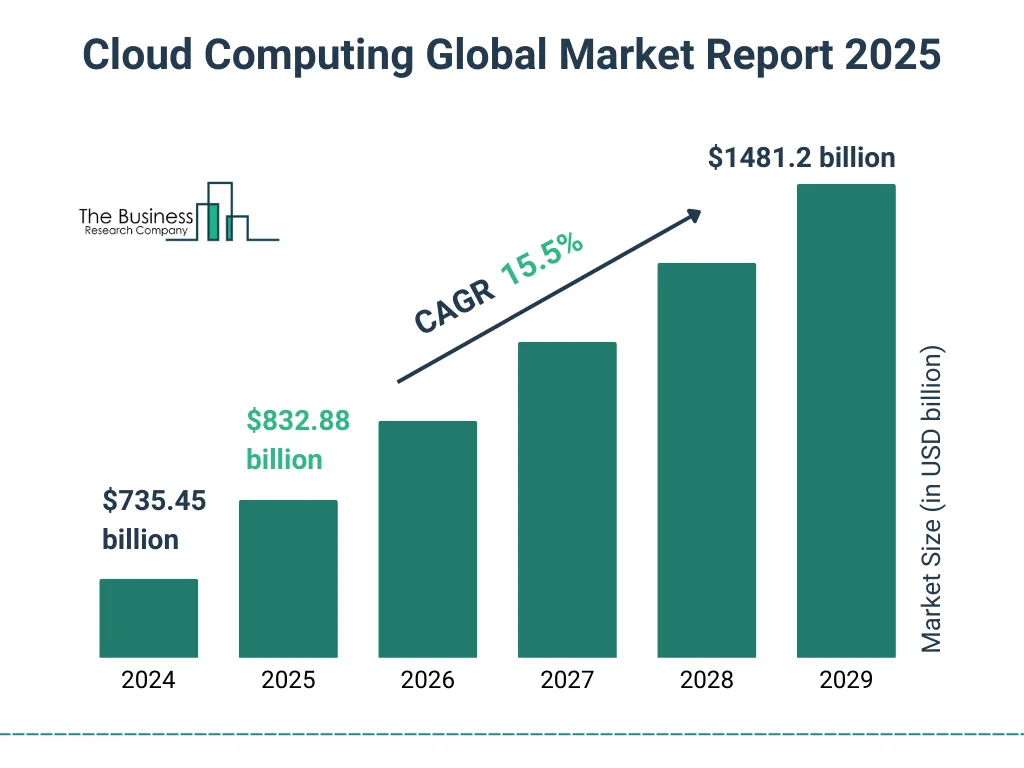
- The global cloud computing market is projected to reach $832.9 billion in 2025.
- By 2029, the market is expected to grow to $1.48 trillion, indicating massive scale expansion.
- The industry is growing at a 15.5% CAGR, driven by strong demand for scalable, cost-efficient, and AI-ready infrastructure.

Regional Cloud Adoption Statistics
- North America accounts for $248.07 billion in public cloud revenue (2024), with the U.S. contributing $183.57 billion.
- In Asia‑Pacific (excluding Japan and China), public cloud spending is projected to hit $250 billion in 2025.
- Southeast Asia and India show double‑digit cloud growth rates, driven by digital transformation in government and fintech.
- In Latin America, Brazil leads the public cloud market with revenue of ~$4.9 billion in 2023, expected to grow ~18.7% annually through 2027.
- In South America, public cloud revenue is forecast at $19.28 billion in 2025.
- Europe’s cloud market is growing, from $197 billion in 2023 to a projected $232 billion in 2024.
- In the EU, ~45.2% of enterprises used cloud computing services in 2023.
- In developing markets, cloud adoption is accelerating, especially among SMEs shifting from legacy infrastructure.
Cloud Service Models, SaaS, PaaS, IaaS Statistics
- SaaS is expected to reach $671 billion in market size by 2025.
- In 2024, PaaS and IaaS each accounted for nearly 20% of total public cloud spending.
- The IaaS market is forecast to grow at ~53%, reaching $234 billion by 2025 (from ~$117 billion in 2022).
- PaaS is expected to grow to $164 billion by 2025 (vs ~$113 billion earlier).
- The top three spend areas, SaaS (~$195 billion), IaaS (~$150 billion), and PaaS (~$136 billion).
- SaaS leads because it requires less architectural effort and offers immediate user value.
- Companies often adopt a blend, e.g., SaaS for business apps, PaaS for rapid development, and IaaS for core infrastructure.
- In many enterprises, SaaS makes up over half of cloud spend due to its maturity and broad usage.
Cloud Provider Market Share Breakdown
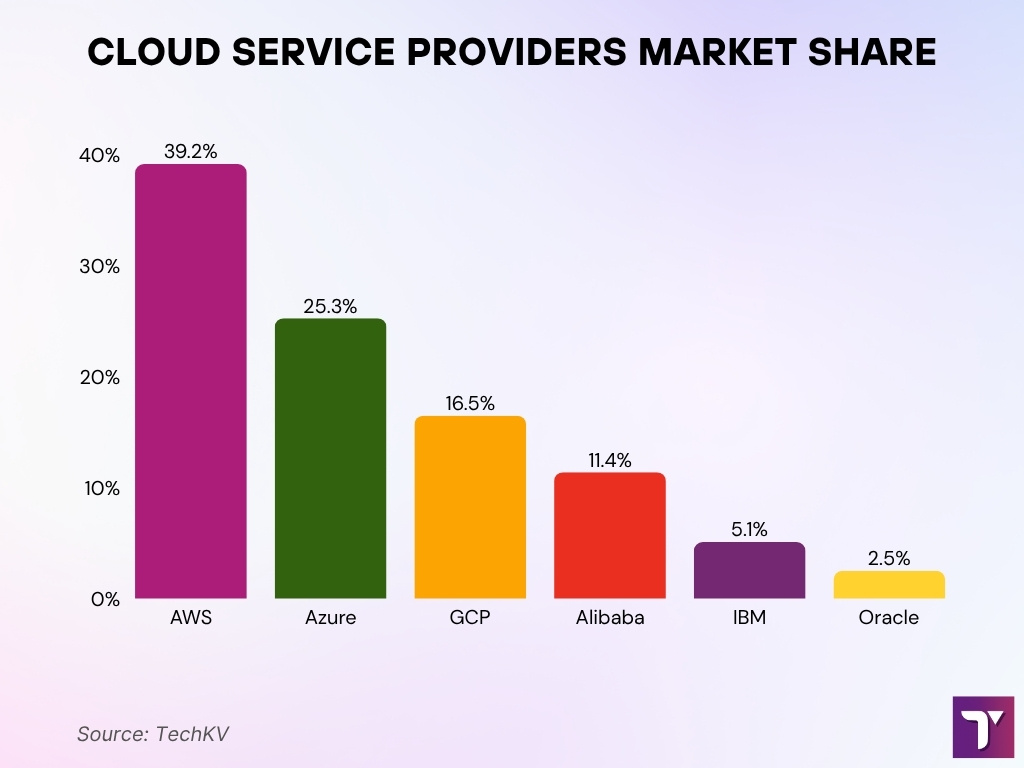
- Amazon Web Services (AWS) dominates with a 39.2% share of the global cloud market.
- Microsoft Azure ranks second, capturing 25.3% of the total market share.
- Google Cloud Platform (GCP) holds 16.5%, reflecting steady enterprise adoption.
- Alibaba Cloud maintains a global footprint with 11.4% market share.
- IBM Cloud contributes a smaller portion at 5.1%, focused on hybrid and enterprise clients.
- Oracle Cloud holds 2.5%, serving niche workloads and database-driven services.

Hybrid and Multi‑Cloud Adoption Trends
- 89% of enterprises now adopt a multi‑cloud strategy.
- Approximately 80% of companies use some form of hybrid cloud architecture.
- 78% of organizations express a preference for hybrid or multi‑cloud setups to avoid vendor lock‑in.
- The hybrid cloud market is forecasted to reach $128.01 billion by 2025.
- 76% of organizations plan to implement hybrid cloud storage models within 12 months.
- Many enterprises combine public clouds for burst workloads with private or on‑premises systems for sensitive data.
- Organizations managing multicloud environments report increased complexity in governance, networking, and security.
- Hybrid strategies also drive demand for unified management tools and FinOps practices.
Spending and Cost Trends
- Global end‑user spending on public cloud services is projected to hit $723.4 billion in 2025, up ~21.5% from 2024.
- All major cloud service segments are expected to see double‑digit growth in 2025.
- IT leaders cite 94% struggle with controlling cloud costs.
- On average, public cloud expenditures exceed budgets by ~15%.
- Spending on cybersecurity overall is forecast to rise 15% in 2025, reaching ~$212 billion globally.
- U.S. cloud security market sees a CAGR of 10.6% from 2025 to 2030.
- The global cloud security market is estimated at $40.81 billion in 2025, with growth toward $175 billion by 2035.
- Many organizations divert increasing budget portions to FinOps, cost governance, and cloud optimization tools.
How Organizations Leverage MSPs for Public Cloud Management
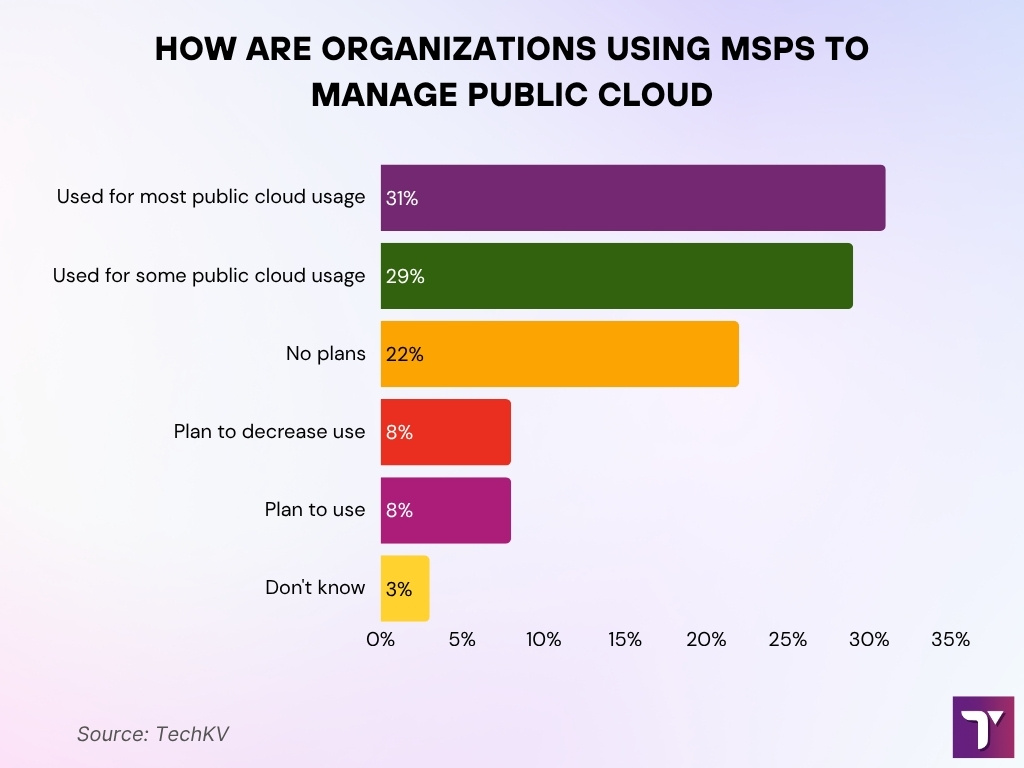
- 31% of organizations rely on MSPs for most of their public cloud operations, reflecting high dependence on external support.
- 29% use MSPs for some cloud activities, indicating a hybrid outsourcing approach.
- 22% have no plans to use MSPs, favoring full in-house cloud management.
- 8% intend to reduce MSP usage, suggesting a shift toward internal capabilities.
- Another 8% plan to adopt MSPs in the future, pointing to potential growth.
- Just 3% are uncertain about their MSP usage, showing strong organizational awareness.

Cost Optimization Statistics
- Among organizations, cost savings is the top cloud initiative for ~60%.
- 65% of organizations measure cloud progress by cost reduction.
- ~31% of IT leaders who stay within budget credit proactive forecasting, monitoring, and optimization tactics.
- 94% of IT decision makers struggle to manage cloud costs due to hidden or untracked expenses.
- Use of rightsizing and autoscaling is rising as a best practice in cloud cost control.
- Many firms adopt FinOps frameworks to align cost visibility with business outcomes.
- Organizations increasingly shift workloads to cheaper regions or lower-cost tiers to trim spending.
- Cloud providers are offering more granular cost models and pricing tiers to support optimization.
Cloud Security Statistics
- 64% of organizations rank cloud security among their top five security priorities, 17% say it’s the number‑one priority.
- 61% of organizations use five or more tools for data discovery, monitoring, or classification.
- 57% of organizations manage encryption key operations using five or more key managers.
- 68% report access‑based attacks (stolen credentials, insufficient access controls) as a leading threat to cloud systems.
- 85% of organizations say at least 40% of their cloud data is sensitive, yet only 66% enforce multi‑factor authentication (MFA).
- 61% of organizations experienced a cloud security incident in the past year, with 21% involving unauthorized access to sensitive data.
- 88% of all data breaches are linked to human error.
- Among root causes of cloud breaches, misconfiguration/human error ~31%, known vulnerability exploitation ~28%, zero‑day exploitation ~24%, MFA failure ~17%.
Most Valued Cloud Benefits for Businesses and Government
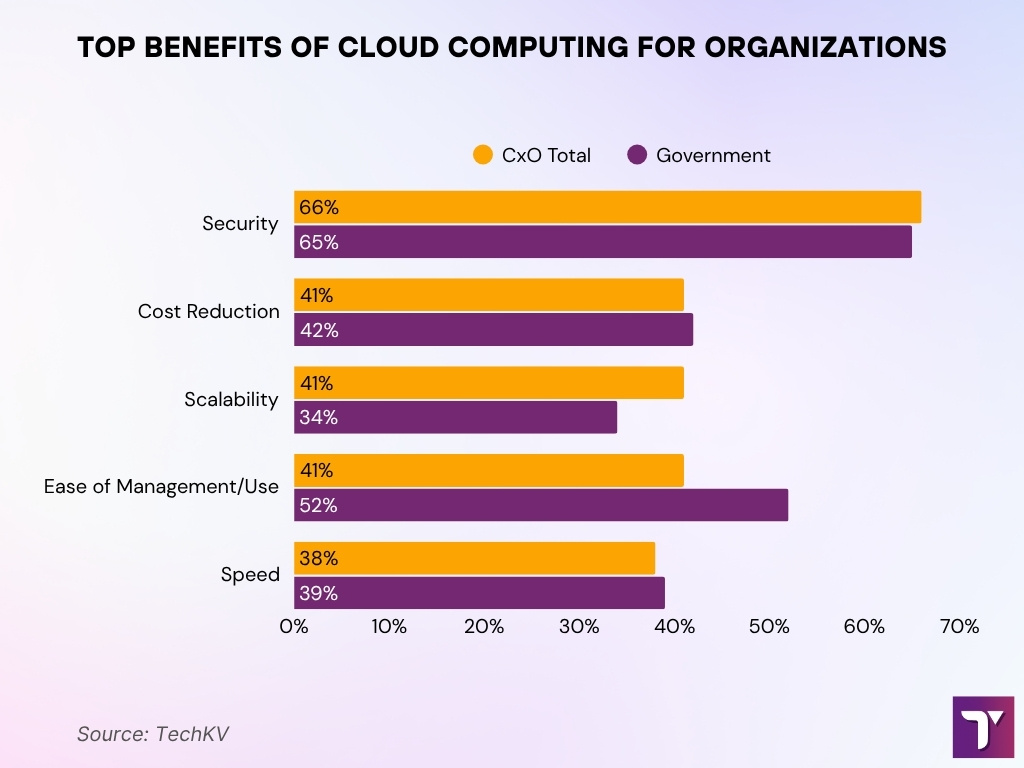
- Security ranks highest, cited by 66% of CxOs and 65% of government leaders as a top benefit.
- Cost reduction is recognized by 41% of CxOs and 42% of government organizations, reflecting shared budgetary priorities.
- Scalability appeals to 41% of CxOs, while only 34% of government respondents prioritize it.
- Ease of management and use is valued by 52% of government users, compared to 41% of CxOs.
- Speed is nearly equally important, with 38% of CxOs and 39% of government leaders highlighting it as a key advantage.

Storage and Data Statistics
- By 2025, 50% of global data will reside in the cloud (vs 25% in 2015).
- Total global data volume is expected to reach 200 zettabytes.
- ~76% of firms plan to adopt a hybrid cloud storage model within 12 months.
- Among enterprises, about 75% already deploy hybrid cloud architectures combining local storage with cloud.
- ~53% of organizations admit their data isn’t fully backed up, immutable, or easily recoverable.
- The average recovery time from a cloud cyberattack is 5 weeks.
- Demand for unstructured data (images, logs, video) is accelerating, placing pressure on scalable cloud storage.
- Storage architectures are evolving, with more layering, caching, and tiering between hot, warm, and cold tiers in cloud environments.
Infrastructure Growth Statistics
- In Q2 2025, global expenditure on cloud infrastructure services hit $99 billion, up ~25% year over year.
- The three largest providers (AWS, Microsoft, Google) continue to hold ~63% of the infrastructure services market.
- Canalys projects 19% growth in global cloud infrastructure spending in 2025.
- Q1 2025 global infrastructure spending was estimated at $90.9 billion, a 21% increase from Q1 2024.
- Hyperscalers in the U.S. are expected to invest nearly $1.2 trillion over three years in cloud and data center expansion.
- In Virginia alone, 54 new data centers were permitted in the first nine months of 2025, 16% more than in 2024.
- Growth is concentrated in AI‑heavy infrastructure (GPU clusters, AI model training farms).
- Some new builds focus on energy efficiency, modular design, and colder climate siting to reduce cooling costs.
Monitoring and Management Statistics
- Infrastructure and operations leaders increasingly adopt observability platforms to monitor distributed cloud systems.
- In a recent academic load balancing test, a dynamic scheduler reduced average response time by ~34% and operational cost by ~15%.
- A survey of edge‑cloud architecture (2025) found that fragmented tooling and standard gaps remain key challenges for unified monitoring.
- Many organizations now run 50+ monitoring agents per cloud environment to cover logs, metrics, tracing, and security events.
- Automated anomaly detection is gaining adoption, reducing mean time to detection (MTTD) by ~20–40%.
- Cloud providers are embedding management APIs and dashboards to centralize views across services.
- Serverless adoption demands new monitoring models (cold starts, ephemeral functions), and research identifies ~19 distinct skills for serverless practitioners.
- A mature FinOps group often integrates cost and performance dashboards to give teams visibility into utilization and waste.
Skills Demand and Workforce Statistics
- 98% of organizations now use or plan to use two or more cloud infrastructure providers; only 9% report having deep multi-cloud experience in-house.
- IDC warns that more than 90% of organizations will face IT skills shortages by 2026, many of those in cloud roles.
- Cloud and AI skills are now among the top 7 most demanded tech skills in 2025.
- In 2025, cloud engineers, architects, and DevOps professionals are seeing peak demand spurred by AI initiatives.
- U.S. Bureau of Labor Statistics projects 15% job growth in cloud computing occupations from 2021 to 2031.
- Some sources assert cloud computing jobs might grow by ~25% over a decade, with hundreds of thousands of roles added.
- In salary trend reports, cloud roles remain among the highest-paying in IT, reflecting their strategic importance.
Industry‑Specific Cloud Usage Statistics
- In gaming, the cloud gaming market is projected to hit $8.17 billion by 2025, with ~293 million users.
- Healthcare uses cloud for telemedicine, patient records, and imaging; adoption is ~70–80% in mature markets.
- Finance (banking, fintech) often places data analytics, fraud detection, and customer apps on the cloud; many run on hybrid models.
- Retail and e‑commerce use cloud for personalization engines, inventory forecasting, and scaling during peak sales.
- Manufacturing and industrial firms are deploying “industrial clouds” for predictive maintenance and IoT platforms.
- Media, entertainment, and streaming use cloud scale for content delivery networks (CDNs) and transcoding workloads.
- In government, adoption is rising slowly due to compliance and sovereignty needs, but “gov cloud” segments are growing.
- Education and research institutions increasingly rely on cloud HPC clusters and shared data platforms for experiments.
Enterprise vs SMB Cloud Usage
- ~96% of companies now use public cloud services, ~84% also use private clouds.
- Among organizations spending on cloud in 2025, 33% invest over $12 million annually.
- SMBs are forecasted to allocate more than 50% of their tech budgets to cloud in 2025.
- ~44% of traditional small businesses already use cloud infrastructure or hosting.
- The public cloud is expected to host 63% of SMB workloads and 62% of SMB data.
- Enterprises tend to use multiple cloud providers and sophisticated architectures, while SMBs prefer turnkey SaaS or managed services.
- Many SMBs rely on MSPs (Managed Service Providers) to assist with cloud deployment and management.
- Larger enterprises adopt vertical cloud stacks and custom integrations, and SMBs use more standardized, out-of-the-box solutions.
Gaming, Edge Computing, and Green Cloud Statistics
- In gaming, cloud gaming platforms and streaming are projected to reach $8+ billion by 2025.
- The edge continuum is enabling more processing to occur near data sources, surveys show developers frequently use edge + cloud models in smart city, IoT, and industrial settings.
- Gartner anticipated that by 2025, 75% of enterprise‑generated data will be created and processed outside centralized data centers (at the edge).
- Data centers currently account for about 2–3% of global electricity usage, with projections reaching up to 8% by 2030 depending on AI demand.
- The European Climate Neutral Data Centre Pact pushes providers to adopt 100% carbon‑free energy and efficiency metrics by 2025.
- Sustainable cloud design (renewable energy, waste heat reuse) is a decision factor in cloud provider selection.
- Green compute regions (northern latitudes, hydro power) are preferred for large AI training tasks to minimize carbon footprint.
- Mixed edge/cloud architectures reduce latency and network load, benefiting gaming, AR/VR, and real‑time applications.
Frequently Asked Questions (FAQs)
Global public cloud spending is forecast to reach $723.4 billion in 2025.
Together, they hold about 63 % of the global cloud infrastructure services market.
87 % of organizations say they face a cloud skills gap.
33 % of organizations are projected to spend over $12 million annually on public cloud services.
Conclusion
The cloud ecosystem today is marked by sustained growth across infrastructure, services, and adoption. Enterprises and SMBs alike are increasing investments, with infrastructure spending accelerating and AI workloads driving new demand. Meanwhile, talent shortages, sustainability pressures, and complexity in monitoring are tangible challenges. As edge architectures and green initiatives rise, cloud evolution will depend as much on operational maturity and governance as on raw scale. These numbers hint at where the cloud journey is headed, but the full picture lies ahead in deeper analysis.
