There is no underselling of the fact that the iPhone has changed the way the world sees smartphones. From its initial launch in 2007, the Apple flagship has come a long way. It has been so popular that we can quickly find insights about iPhone sales and user behaviors. In this statistics article, we take a look at some significant iPhone user and sales statistics. We will start with some basic statistics on iPhone user statistics.
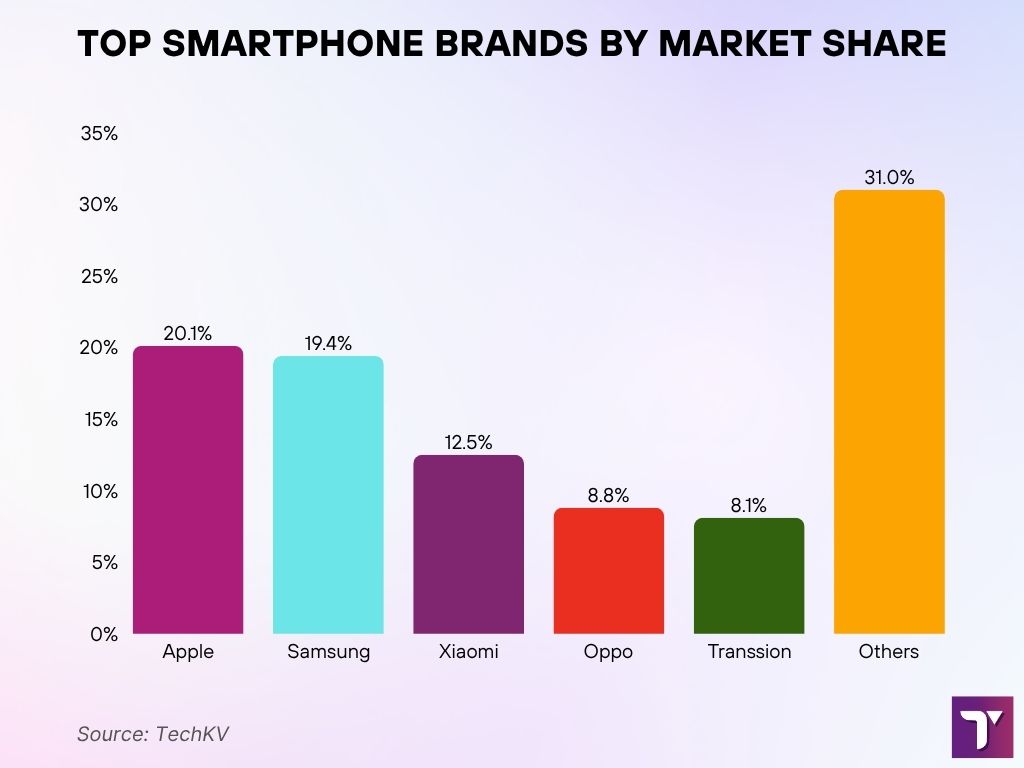
Top Smartphone Brands by Market Share
- Apple led the global market with a 20.1% share, overtaking Samsung as the No. 1 smartphone brand.
- Samsung followed closely with a 19.4% share, reflecting a slight dip in its dominance.
- Xiaomi held the third spot, capturing 12.5% of total smartphone shipments worldwide.
- Oppo secured an 8.8% market share, maintaining its strong presence in Asian markets.
- Transsion, known for its focus on emerging markets, recorded an 8.1% share.
- The Others category, comprising smaller brands, accounted for a significant 31% of global shipments.
Socioeconomic Status of Typical iPhone Users
- iPhone users in 2025 have an average annual income of over $105,000, significantly higher than Android users at around $72,000.
- More than 68% of iPhone users hold a college degree or higher, compared to just 52% of Android users.
- 74% of iPhone users live in urban or metropolitan areas, though rural adoption has risen by 9% year-over-year.
Average Daily Usage and Usage Patterns
- iPhone users in 2025 spend an average of 4.6 hours daily on their devices across all age groups.
- Users aged 18-34 now average 5.8 hours of screen time per day, with video-heavy apps leading the surge.
- Instagram, TikTok, WhatsApp, and YouTube are the top 4 most-used apps among iPhone users globally.
- iPhone users engage with around 37 apps per month, up from 30 last year, driven by utility and finance categories.
- The average iPhone is unlocked 96 times per day, reflecting increased short-session usage behavior.
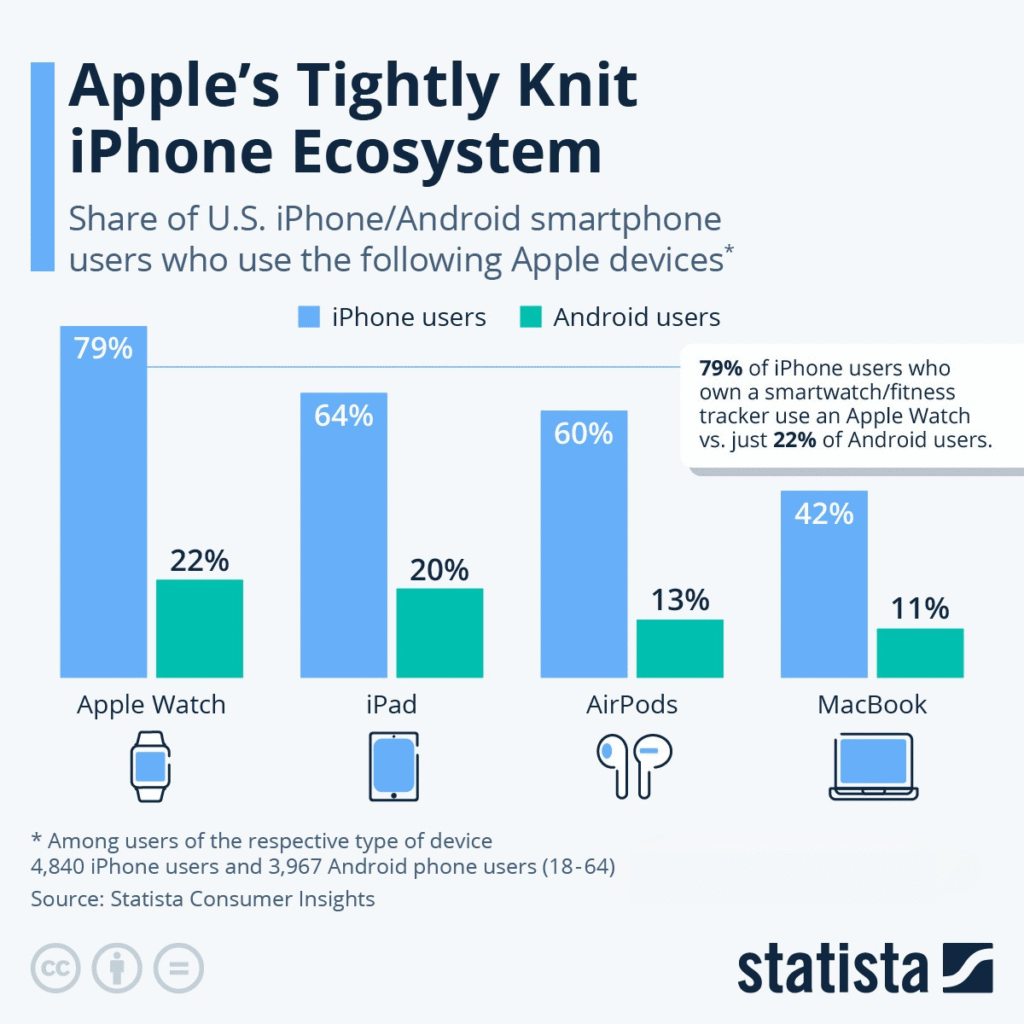
Apple Ecosystem Usage Among U.S. Smartphone Users
- 79% of iPhone users with a smartwatch/fitness tracker use an Apple Watch, compared to just 22% of Android users.
- 64% of iPhone users also own an iPad, while only 20% of Android users do.
- 60% of iPhone users use AirPods, versus just 13% of Android users.
- 42% of iPhone users have a MacBook, compared to only 11% of Android users.
User Satisfaction Ratings and Common Factors
- Overall iPhone satisfaction rate in 2025 stands at 97%, with newer models like the iPhone 15 Pro scoring 98.5%.
- Seamless ecosystem integration across Mac, iPad, Apple Watch, and AirPods remains the top reason for user satisfaction.
- 81% of iPhone users cite brand trust and reliability as key reasons for sticking with Apple over Android.
- 12% of former iPhone users switched to Android in 2025, mostly for customization and pricing flexibility.
- User satisfaction would drop by up to 21%, based on surveys, if Apple’s cross-device integration weakened.
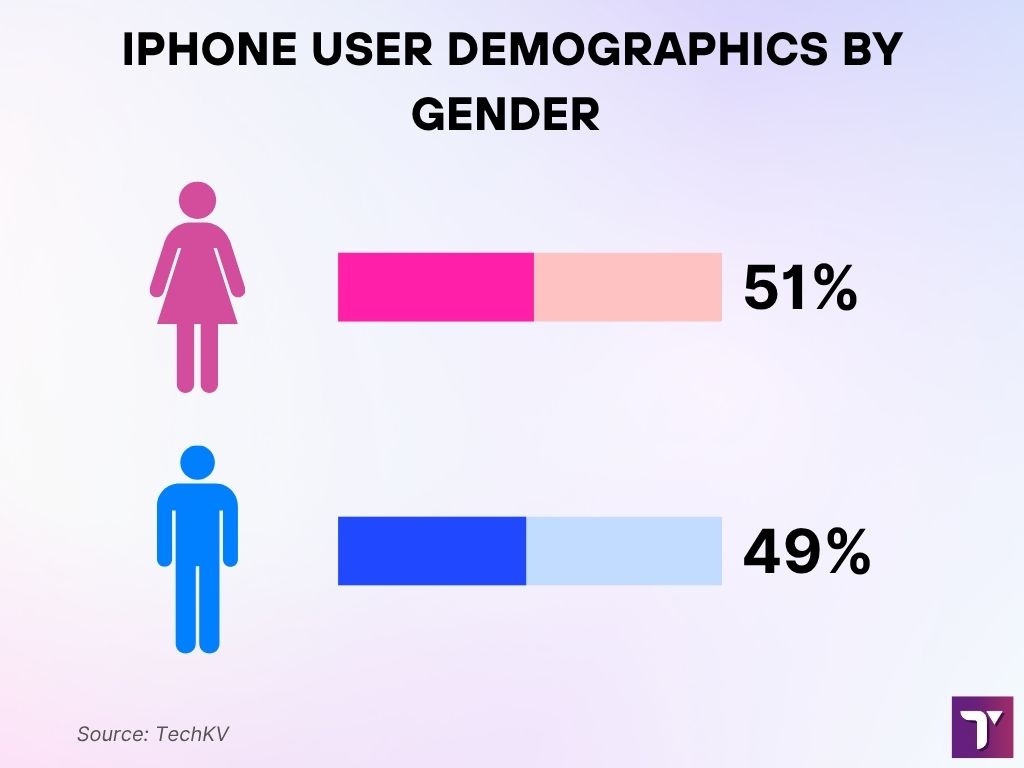
iPhone User Demographics by Gender
- 51% of iPhone users in the U.S. are female, showing a slightly higher adoption rate among women.
- 49% of iPhone users are male, reflecting a nearly even gender distribution in Apple’s user base.
Historical iPhone Sales Data
- Apple sold approximately 239 million iPhones in 2025, marking a 3.1% increase from the previous year’s total.
- The all-time record still stands at 242 million units sold in 2021, with 2025 coming in as the second-highest year.
- In 2010, just 47.4 million iPhones were sold, showing a 5x growth over the last 15 years.
- iPhone sales are projected to surpass 260 million units by 2030, driven by demand for AI and spatial computing features.
- The US led 2025 regional sales with over 102 million iPhones sold, maintaining its top spot globally.
- China followed with 58.6 million units, driven by strong demand for the iPhone 15 Pro Max and 16 models.
- Europe accounted for 59.2 million iPhone sales, with Germany, France, and the UK leading the region.
- Asia-Pacific excluding Japan and China saw 17.1 million units sold, boosted by emerging market upgrades.
- The iPhone 15 series fueled strong Q4 2025 results, helping Apple capture a 25.3% global smartphone market share.
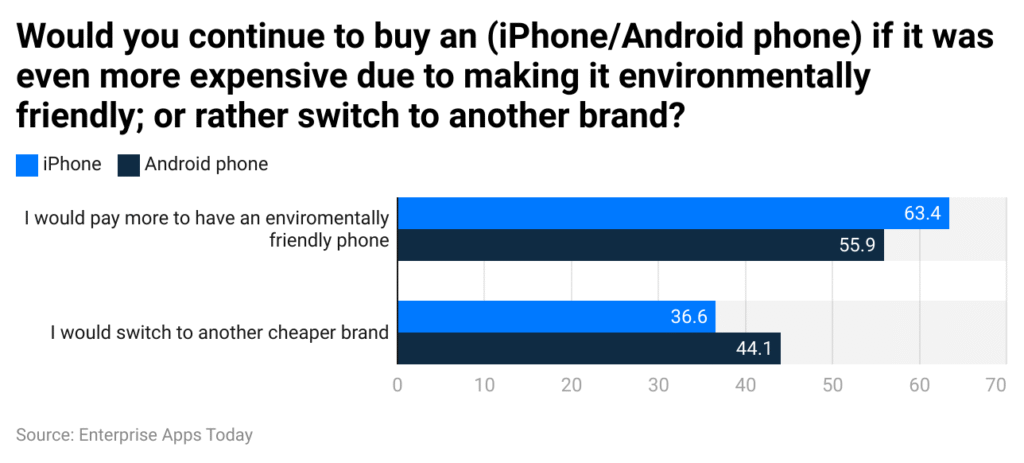
Consumer Preferences for Eco-Friendly Smartphones
- 63.4% of iPhone users are willing to pay more for an environmentally friendly phone, showing stronger eco-conscious loyalty.
- 55.9% of Android users would also pay more for eco-friendly devices, though slightly less than iPhone users.
- 36.6% of iPhone users said they would switch to a cheaper brand if costs increased for eco features.
- 44.1% of Android users are more likely to switch brands to save money on eco-related price hikes.
Recent iPhone Sales Trends
- Apple sold 239 million iPhones globally in 2025, making it the second-strongest sales year after 2021.
- Q4 2025 contributed over 31% of total sales, driven by holiday demand and the iPhone 16 launch.
- iPhone sales in India reached 9.1 million units, setting a new national record.
- China saw 58.6 million units sold, with strong growth in premium-tier models.
- The average selling price rose 4.4% in 2025, showing a continued trend toward higher-end iPhones.
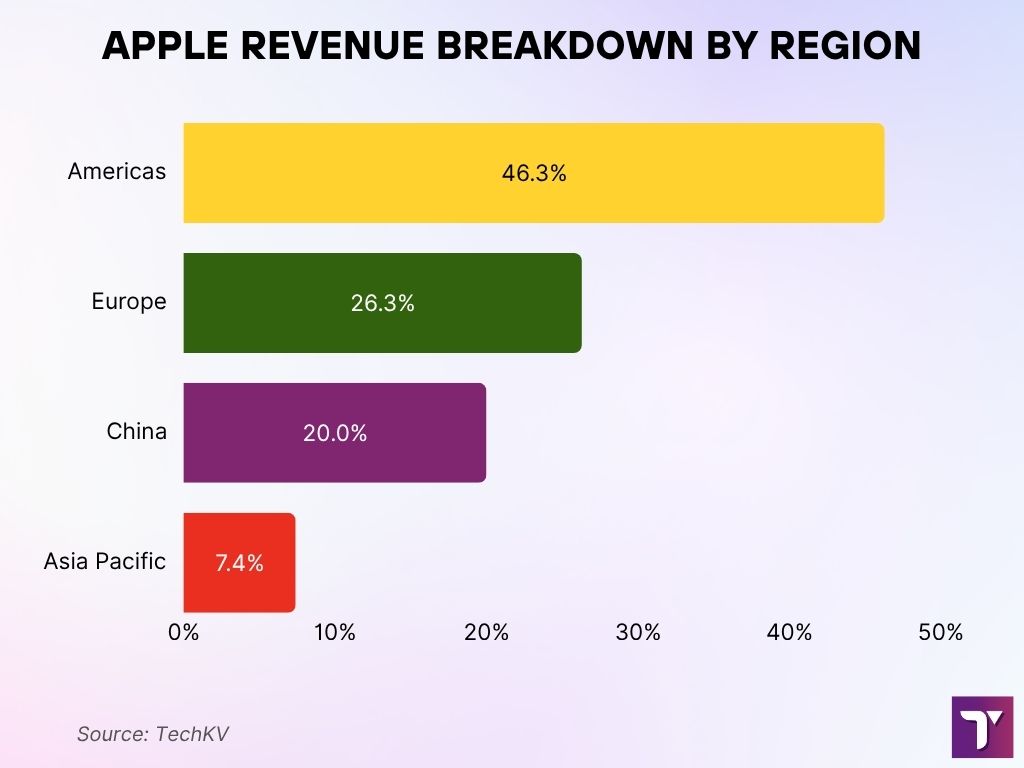
Apple Revenue Breakdown by Region
- The Americas led Apple’s revenue distribution with a dominant 46.3% share.
- Europe contributed 26.3% to Apple’s global earnings in 2025.
- China accounted for a notable 20.0% of Apple’s total revenue.
- The Asia Pacific region made up 7.4%, reflecting a smaller but steady presence.
Technological Developments
- Over 63% of iPhones in circulation now use eSIM, as physical SIM slots are gradually phased out.
- Nearly 52% of iPhone users also own an Apple Watch or AirPods, showing deeper ecosystem integration.
- Apple is introducing dynamic hardware-software customization, especially in accessibility and lock screen features.
- AI-driven photography tools now enhance image quality, auto-cropping, and real-time scene recognition.
- Around 92% of active iPhone models support 5G as of late 2025, improving download speeds and app responsiveness.
Conclusion
What do you think about these statistics on iPhone users and sales figures? I believe these numbers will have a continued impact on the global economy as well as the smartphone market. The increasing command of Apple over the premium segment is evident in these trends, and the company is looking forward to results from several growing markets.
2 Comments
iPhone sales keep going strong! I guess people really love that smooth Apple experience—including me. 🙂
Very nice . iPhone functions is very good 👍. Apple is a very good brand.