Smart home technology is no longer futuristic; it’s becoming standard. More households are connecting lights, locks, speakers, and appliances into seamless systems. For example, real estate listings now often highlight pre‑wired smart systems as a selling point, and utility companies partner with thermostat makers to shave peak energy costs. In the short piece below, we set the stage with key metrics. Read on to explore detailed trends, adoption rates, and what’s driving (or holding back) the smart home era.
Editor’s Choice
- 63% of U.S. households now own at least one smart home device (e.g., connected speakers, lights).
- Smart security systems in U.S. homes grew 38% compared to 2023.
- There are an estimated 72 million smart speakers in use across U.S. homes in 2025.
- 44% of homeowners under age 35 report using multiple smart devices daily.
- Average spending per smart home household in the U.S. is estimated at ~$500–$700 per year, depending on the level of integration and subscription services.
- Globally, 56% of consumers cite energy savings as their top reason for adopting smart home tech.
- Smart home device adoption has increased fivefold over the past decade, reaching 45% of U.S. internet households.
Recent Developments
- The global smart home market is projected to hit $192 billion in 2025, compared to $113 billion in 2022.
- IoT (Internet of Things) devices globally are expected to top 20.1 billion in 2025, up ~13% year-on-year.
- In the U.S., 57% of households are anticipated to own one or more IoT (or smart home) devices by the end of 2025.
- Smart home devices now reach about 45% of U.S. internet-connected households.
- The average U.S. household with connectivity owns ~17 connected devices.
- Nearly one in five (18%) U.S. homes now have six or more smart home devices.
- Researchers deployed scalable WiFi-based sensing systems across 10 million routers and 100 million smart bulbs, achieving ~92.6% motion detection accuracy and greatly reducing false alarms.
- Standardization efforts have advanced, and the Matter protocol is helping unify smart device interoperability across brands.
Global Smart Home Market Forecast Highlights
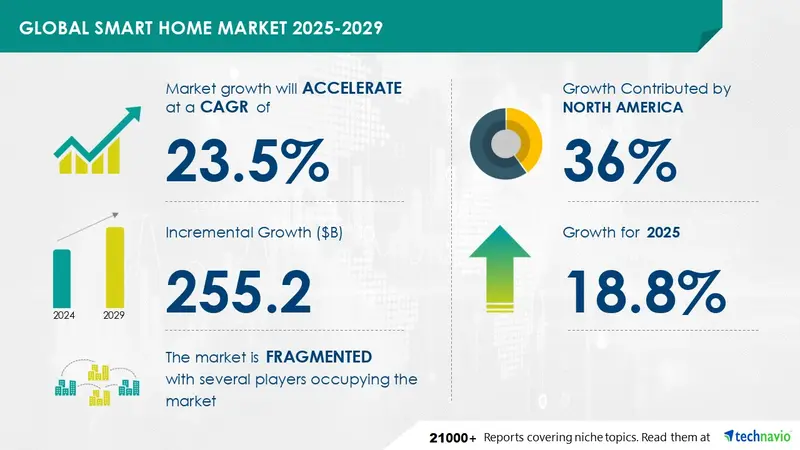
- The global smart home market is projected to expand at a CAGR of 23.5% from 2025 to 2029.
- The industry is expected to see an incremental growth of $255.2 billion during this forecast period.
- North America will account for around 36% of total market growth, driven by high smart device adoption and IoT integration.
- In 2025 alone, the market is set to rise by 18.8%, signaling strong early-cycle momentum.
- The sector remains highly fragmented, with multiple leading players competing for market dominance across device categories and regions.
Smart Home Market Overview
- The global smart home market is forecast to reach $192 billion by 2025.
- In 2022, the market was around $113 billion, implying a compound annual growth rate (CAGR) of over 19%.
- In the U.S., security systems make up ~33% of smart home spending in 2025.
- Entertainment systems (smart TVs, speakers) account for ~25% of revenue.
- Smart energy systems (e.g., thermostats, smart plugs) represent ~19% of spend.
- Smart kitchens (appliances) have seen a 21% year-over-year sales increase.
- Installation and integration services alone generate $8.6 billion in 2025.
- Subscription services (cloud, AI analytics) exceed $3.2 billion.
- DIY smart home kits make up ~16% of the market, showing strong consumer confidence.
Global Smart Home Adoption Rates
- 45% of U.S. internet households now own core smart home devices.
- Adoption has increased fivefold over 10 years in the U.S.
- Globally, 56% of consumers say energy savings is their top adoption driver.
- In U.S. markets, 63% of households have at least one smart device in 2025.
- In the U.S., households average ~17 connected devices.
- In more mature markets, adoption often exceeds 50% (e.g., parts of Europe, East Asia), though precise figures vary by country.
- Markets with strong utility subsidies or regulations (e.g., parts of the EU) show faster transitions to smart thermostats and energy control systems.
- Some developing markets still lag, often below 20% adoption, due to connectivity, cost, and infrastructure gaps.
Top Smart Home Management Apps by Market Share
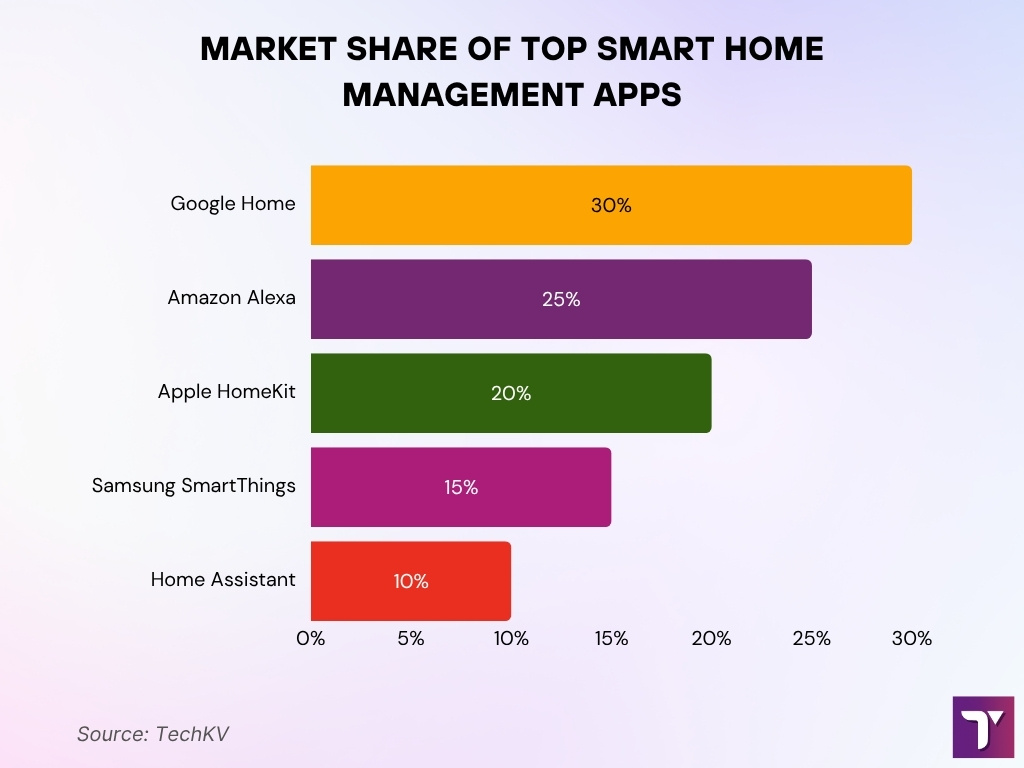
- Google Home dominates the market with a 30% share, ranking as the most popular smart home app in 2025.
- Amazon Alexa follows closely with a 25% share, leveraging its vast device ecosystem and voice integration.
- Apple HomeKit holds a 20% share, driven by its seamless compatibility across iOS devices.
- Samsung SmartThings maintains a 15% share, sustaining its influence through multi-device connectivity.
- Home Assistant secures a 10% share, favored by tech-savvy and privacy-focused users seeking customization.
Smart Home Market Growth Trends
- The global smart home market’s CAGR is estimated to be above 19% from 2022 to 2025.
- IoT device growth is ~13% annually, reaching 20.1 billion devices in 2025.
- Voice assistants and smart speakers remain growth anchors, with 72 million smart speakers in U.S. homes in 2025.
- Smart kitchen and appliance sectors grew ~21% year-over-year.
- Integration and installation services are rising faster, contributing $8.6 billion in revenue.
- Subscription and cloud services now exceed $3.2 billion, showing a shift toward recurring revenue.
- The DIY segment (16%) suggests consumers are more willing to self-install, lowering barriers.
- Standardization via Matter may remove friction and accelerate device compatibility, further boosting growth.
- Wi-Fi-sensing and other innovations reduce the need for dedicated sensors, simplifying deployment in many homes.
Smart Home Demographics
- Younger homeowners dominate, 44% of users under age 35 use multiple smart devices daily.
- Homes with children adopt smart devices ~21% more than child-free households.
- The average U.S. connected household owns 17 smart devices as of 2025.
- During the pandemic, the average peaked at 8 devices, but has since dropped to 6.2 devices per household due to new users with simpler setups.
- Adoption is higher in urban and suburban markets than in rural areas.
- Higher income brackets (top 20%) are 2× more likely to own smart home systems than the bottom 20%.
- Early adopters (tech enthusiasts) still account for a disproportionate share of advanced system installations.
- Older people over 65 show rising interest in smart home tech for “aging in place”, especially for safety and fall detection.
Most Wanted Smart Home Devices
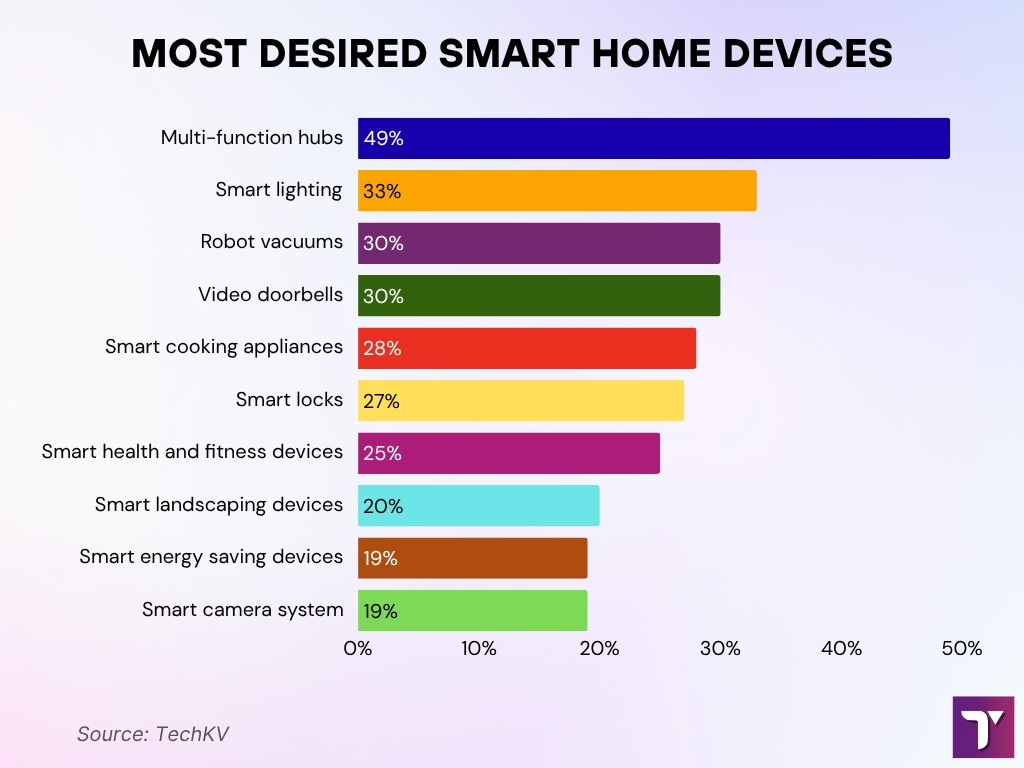
- 49% of consumers want multi-function hubs, making them the top-demanded smart home device.
- 33% are interested in smart lighting, valued for its ambiance control and energy savings.
- 30% desire both robot vacuums and video doorbells, reflecting needs for convenience and home security.
- 28% prefer smart cooking appliances, signaling growth in connected kitchen adoption.
- 27% are looking for smart locks to enhance household security.
- 25% want smart health and fitness devices, tying wellness with home automation.
- 20% express interest in smart landscaping devices, showing a push toward outdoor automation.
- 19% seek smart energy-saving devices, highlighting eco-conscious priorities.
- Another 19% prioritize smart camera systems, underscoring continued demand for surveillance and safety.
Benefits of Smart Home Technology
- Energy savings tops the list, 56% of consumers cite it as the main reason to adopt smart systems.
- Smart thermostats are installed in 28% of U.S. homes, enabling demand-based HVAC control.
- Security enhancements, ~33% of homes now install smart doorbells, and 29% use indoor security cameras.
- Convenience and automation, smart lighting in 38% of smart homes.
- Preventive maintenance, leak, and moisture sensors are now adopted in 14% of homes, reducing damage risk.
- Appliance automation (e.g., smart ovens, fridges) cuts daily friction and enables remote control.
- Home value uplift, smart systems can increase resale value, often cited at ~5% on property listings.
- Remote monitoring and control reduce household stress, particularly for multi-home or travel‑frequent owners.
Consumer Demand for Smart Homes
- 57% of U.S. households are expected to have smart home devices by the end of 2025.
- Smart home device adoption in U.S. internet households has increased fivefold over the past 10 years, now at 45%.
- In 2025, 63% of U.S. households own at least one smart device (e.g., light, lock).
- Nearly 18% of households now have six or more smart devices.
- 51% of U.S. consumers say home security automation is their top motivator for adoption.
- Average revenue per U.S. smart home (device + service) is estimated at $546.50.
- Growth is shifting from core devices to bundled service ecosystems, increasing demand for integration.
- Entry devices like smart plugs and doorbells often act as gateways that spur further system purchases.
- Some consumers delay adoption due to concerns about complexity, privacy, and cost.
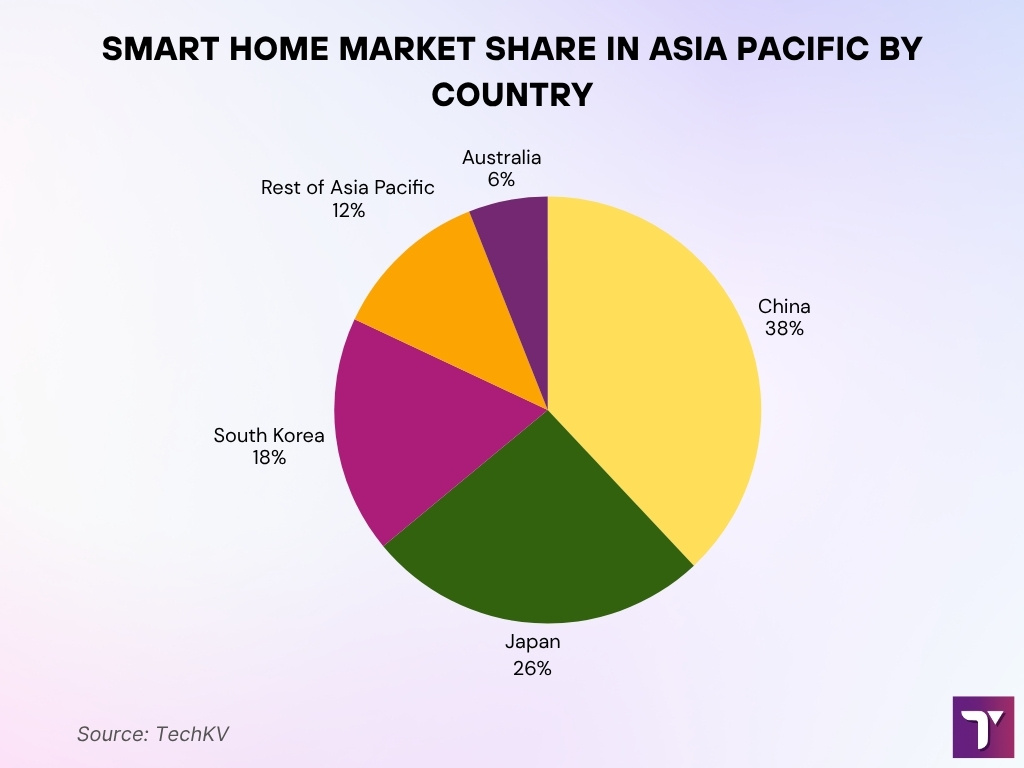
Smart Home Market Share by Country in the Asia Pacific
- China leads the region with a 38% market share, marking it as the top smart home investor in the Asia Pacific.
- Japan follows with a 26% share, showcasing strong adoption of connected technologies.
- South Korea holds about 18%, supported by its highly tech-savvy population.
- The Rest of the Asia Pacific region represents 12%, reflecting steady but uneven growth across emerging markets.
- Australia accounts for the remaining 6%, maintaining the smallest share among major contributors.
Popular Smart Home Systems and Features
- Smart speakers/voice assistants remain dominant, 72 million U.S. households own one in 2025.
- Smart lighting is present in ~38% of smart homes.
- Smart plugs/outlets have ~31% adoption due to simplicity and energy tracking benefits.
- Smart doorbells are installed in ~33% of homes.
- Indoor security cameras are used in ~29% of connected homes.
- Robotics, robot vacuum cleaners are owned by 25% of households in 2025.
- Smart TVs are in ~71% of connected homes, often integrated with voice assistant features.
- Smart thermostats are now installed in 28% of U.S. homes.
- Leak sensors, motion sensors, and environmental sensors (CO₂, humidity) increasingly supplement core systems.
Smart Home Segment Statistics (Lighting, Security, Appliances, etc.)
- The smart appliances market is valued at $42.51 billion in 2025, forecast to reach 81.05B by 2033.
- Security and access control held ~29%+ share of smart home product revenue in 2024.
- Entertainment (TVs, speakers) and lighting also remain large revenue segments, lighting ~26%, security ~23% of smart device share.
- In global forecasts, the smart home market sees a CAGR of ~20.47% from 2025 to 2035.
- The automation technology submarket (wired + wireless systems) is projected to $80.1 billion in 2025.
- Wired systems will still command ~47% share of the automation market in 2025.
Regional Smart Home Market Breakdown
- North America leads in market share, with ~25%+ of the global smart home industry in 2024.
- Asia-Pacific is the fastest‑growing region thanks to rapid urbanization and increasing incomes.
- In 2025, North America is projected to maintain dominance in revenue share, while APAC leads in growth rates.
- Europe holds ~21.4% of the global smart home revenue in 2025, per one market forecast.
- In 2025’s global market of ~$116.4 billion, North America accounts for ~27.1% share.
- South America is estimated to hold ~7.6%, the Middle East ~4.9%, and Africa ~2.5% of the global share in 2025.
- In 2024, U.S. smart home revenue was ~$23,716.2 million, with a forecasted CAGR to 2030 at 23.4%.
- Some reports suggest the U.S. market will grow from ~$29,609 million in 2023 to ~$119,184 million by 2030.
- Regions like the Middle East, Africa, and Latin America are showing promising adoption, though from lower baselines, driven by infrastructure investments.
Key Smart Home Industry Players
- Amazon’s Alexa ecosystem powers over 500 million smart devices worldwide, solidifying its leadership in voice assistant–driven home automation.
- Google Nest controls more than 200 million devices, notably in smart thermostats and security solutions.
- Samsung Electronics features over 100 million smart home devices, with its SmartThings platform connecting myriad products, including refrigerators, TVs, and sensors.
- LG Electronics ranks among the top smart appliance vendors, accounting for approximately 12% of global smart washing machine shipments in 2024.
- Siemens holds over 30% market share in European smart building systems, focusing on advanced energy management and automation platforms.
- Schneider Electric operates in 115+ countries, deploying millions of residential smart meters and automation controls annually.
- Philips Lighting (Signify) encompasses 80 million+ smart light points installed globally, leading in connected lighting.
- Legrand has built partnerships with dozens of leading IoT brands, with its smart switches and outlets integrated into nearly 25 million homes worldwide.
- ABB, with smart home solutions such as ABB-free@home, serves over 60 countries and supports multi-protocol integration for lighting, heating, and security systems.
- Assa Abloy’s smart lock division sells more than 5 million connected locks per year, dominating the residential access control market.
- Vivint manages 27 million smart home devices for more than 2 million residential customers across the United States.
- Control4, a unit of SnapAV, connects with 13,500+ third-party smart devices and is deployed in over 400,000 homes globally.
- Haier Smart Home leverages IoT integration with over 350 million connected appliances under its parent group’s brands.
- Apple HomeKit powers more than 250 million compatible smart devices worldwide, driving seamless ecosystem adoption through iOS.
- The industry records annual M&A deal values exceeding $8 billion, as companies pursue ecosystem consolidation and improved device interoperability.
AI and Automation in Smart Homes
- The autonomous AI and IoT segment is forecasted to grow from ~$14.2 billion in 2024 to ~$138.7 billion by 2034 (CAGR ~25.6%).
- Smart home automation technology (wired + wireless control systems) is estimated at $80.1 billion in 2025, with projected growth to $227.3 billion by 2035.
- Within that domain, wired systems still hold ~47.2% share in 2025.
- Energy management and smart scheduling systems in experimental deployments have shown up to 62% energy cost reduction and 44% peak-to-average ratio reduction vs baseline.
- More autonomous edge computing (decision-making locally) reduces latency and dependence on cloud connectivity.
- Use of standardization, like Matter and Thread, helps AI systems orchestrate devices across brands, reducing fragmentation.
- Growth in voice assistants and natural language interfaces lets users drive automation by voice or routines, not manual control.
Smart Home Security and Privacy Concerns
- The smart home security systems market is expected to grow from $63.3 billion in 2024 to ~$68.8 billion in 2025 (CAGR ~8.7%).
- Some forecasts cite a CAGR of ~12.5% for the smart home security market from 2025 onwards.
- In consumer surveys, 60% of prospective buyers name privacy as a top concern, and 56% worry about cybersecurity threats.
- Studies show many smart devices still use outdated TLS versions and weak encryption, exposing vulnerabilities.
- On average, one smart TV in research was found to ping ~350 unique third‑party domains, raising tracking and data exposure issues.
- Recent academic proposals use local differential privacy and obfuscation to protect user data in smart homes.
- In China, product teams emphasize compliance with national security over user privacy, affecting design choices in devices destined for that market.
- Consumer reluctance to share behavior or presence data often slows the adoption of advanced automation.
Smart Home System Installation Costs
- Installation cost ranges from $205 to $1,659 for standard smart systems in 2025.
- Basic home automation packages often cost $2,000 to $4,000 for small-to-mid setups.
- The average single smart home cost is sometimes quoted as $895, with ranges extending to $3,000 for extensive setups.
- In new smart home real estate listings, the 2025 average smart‑home price is ~$1,224,763, versus ~$663,847 for non-smart homes.
- Homeowners expect to pay ~$18,056 extra for smart features in a home.
- In single-room setups (smart bulbs, switch, hub), $200–$500 is common; whole-house systems often exceed $2,000, especially with pro installation.
- Security system add-ons (cameras, sensors, locks) add incremental costs; sometimes a basic security installation costs ~$400.
Frequently Asked Questions (FAQs)
The global smart home market is projected to reach $162.27 billion in 2025.
The WiFi sensing deployment spans over 10 million commodity routers and 100 million smart bulbs, achieving 92.61 % motion detection accuracy.
The single‑family smart home market was $116.9 billion in 2024 and is expected to reach $137.99 billion in 2025, growing at a CAGR of 18.0%.
The smart home market is forecast to grow with a compound annual growth rate (CAGR) of 23.5% between 2024 and 2029.
Conclusion
The smart home sector today is no longer a niche; it’s a growing mainstream force. Regional dynamics, leading players, and accelerated AI and automation are reshaping how consumers interact with and control their living environments. That said, security, privacy, and installation costs remain real barriers to full adoption. As devices harmonize behind standards like Matter and AI becomes more capable, smart homes may soon feel as essential as electricity. Read on to dive deeper into adoption across demographics, benefits, and future forecasts.
