It’s 7:15 a.m. in a smart home in suburban Texas. The lights gradually turn on. A smartwatch buzzes with health data while a coffee machine starts brewing, all without human intervention. This isn’t the future; it’s the present-day norm in millions of households across the United States. As we step deeper into 2025, our relationship with technology is more embedded, more intuitive, and more data-driven than ever.
Understanding how Americans use technology today gives us a lens into shifting behaviors, workplace transformations, and what digital equity really means in a hyper-connected world.
Editor’s Choice
- 86% of U.S. adults owned a smartphone in 2025,
- 92% of Gen Z use social media daily, making them the most digitally engaged age group.
- 69% of remote employees rely on cloud-based collaboration tools every day.
- 78% of students in the U.S. attend classes using hybrid or fully online platforms.
- 82% of online shoppers in 2025 have made a purchase using a mobile device.
- 41% of U.S. homes now use at least one smart home device connected via IoT.
- 59% of AI technology users report improved productivity at work due to automation tools.
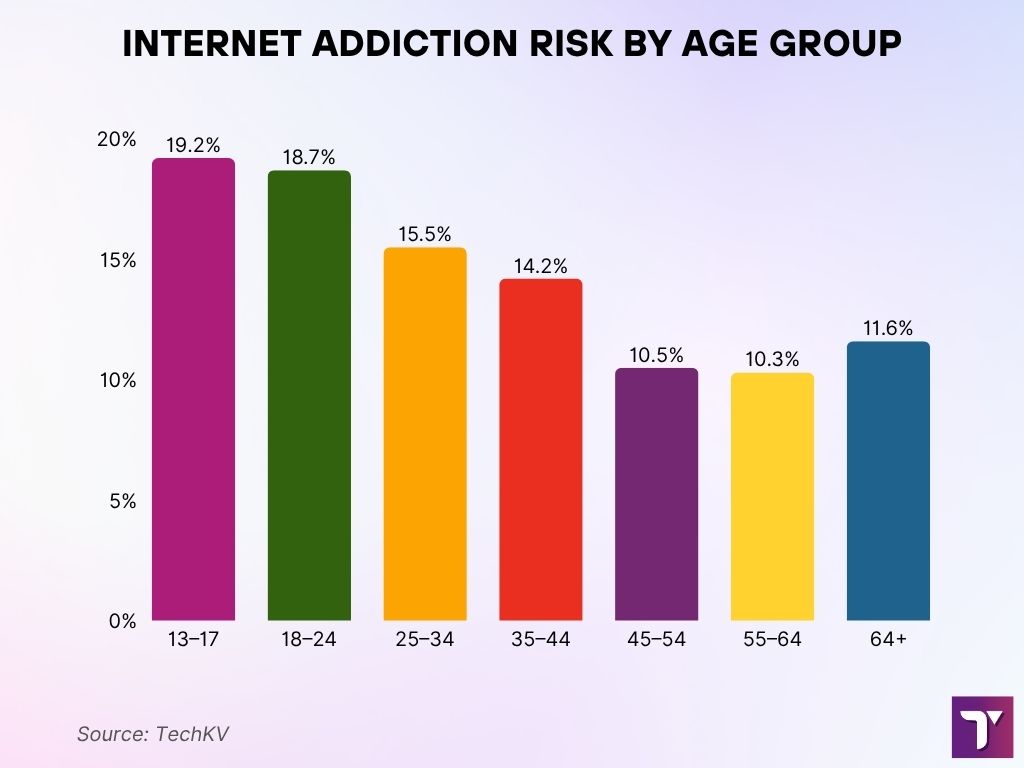
Internet Addiction Risk by Age: Who’s Most Vulnerable?
- Teens (13–17) show the highest risk of internet addiction, contributing 19.2% to the total share.
- Young adults (18–24) are not far behind, making up 18.7% of the overall risk.
- People aged 25–34 account for 15.5%, reflecting continued high digital engagement in early adulthood.
- The 35–44 age group contributes 14.2%, signaling a gradual decline as age increases.
- Those aged 45–54 comprise 10.5% of the risk, dipping below the teen and young adult groups.
- Adults 55–64 still show notable vulnerability, with 10.3% of the risk.
- Interestingly, seniors (65+) make up 11.6%, slightly higher than some middle-aged groups, highlighting that older users are not immune.
Mobile Device Usage
- 86% of Americans now own a smartphone,
- 74% of mobile traffic comes from smartphones in 2025, with tablets contributing just 12%.
- 61% of internet users in the U.S. primarily access the web through mobile devices.
- 5.2 hours is the average daily mobile screen time.
- 42% of U.S. households use mobile-only internet (no broadband), a significant shift from wired reliance.
- 53% of mobile users have installed a digital wellness app to manage screen time or sleep patterns.
- 67% of teens aged 13–18 use smartphones for educational purposes weekly.
- 38% of U.S. adults use mobile wallets like Apple Pay or Google Pay for in-store purchases.
- 28% of mobile device users in the U.S. own more than one smartphone.
- 91% of millennials use their mobile devices as their primary camera and video recorder.
Social Media Usage
- 92% of Gen Z use at least one social platform daily.
- 74% of U.S. adults are active on social media in 2025.
- 3.1 hours is the average daily time spent on social media across all devices.
- 65% of users follow brands or influencers, indicating strong commercial engagement.
- 59% of social media users engage with content through short-form video platforms like TikTok and Instagram Reels.
- 33% of news consumption in the U.S. now occurs through social media channels.
- 81% of small businesses use social media as their primary marketing tool.
- 41% of U.S. adults report taking a break from at least one platform due to burnout or privacy concerns.
- 69% of users aged 30–45 say social media helps them stay in touch with local community events.
- 50% of social media users actively manage two or more profiles across platforms.
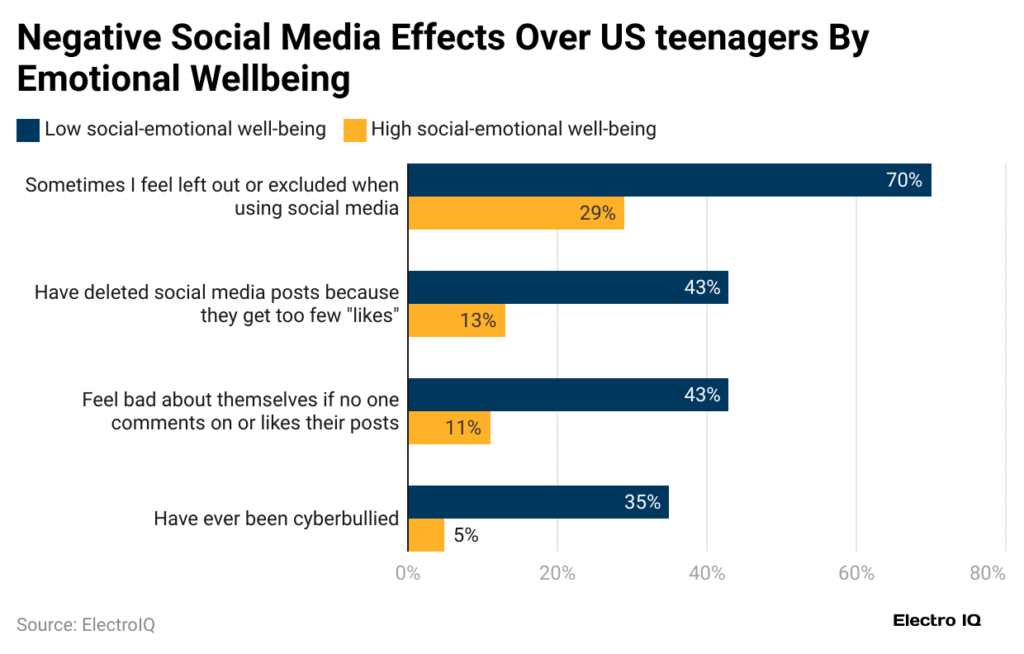
Emotional Toll of Social Media on US Teens
- A striking 70% of teens with low emotional well-being said they felt left out or excluded on social media, while only 29% of their high well-being peers felt that way.
- 43% of low well-being teens deleted posts for not getting enough “likes,” compared to just 13% among those with high well-being.
- Another 43% of emotionally struggling teens felt bad when their posts received no engagement, whereas only 11% of high well-being teens shared that feeling.
- Cyberbullying hit 35% of low well-being teens, but just 5% of high well-being teens reported similar experiences, showing a sharp contrast in digital vulnerability.
Workplace Technology Usage
- 69% of remote workers use collaboration software daily, such as Zoom, Microsoft Teams, or Slack.
- 57% of employers have implemented AI tools to streamline administrative or HR tasks.
- 82% of knowledge workers in the U.S. use cloud storage systems like Google Drive or Dropbox.
- 36% of U.S. companies offer a four-day workweek powered by productivity-enhancing tech.
- 91% of IT departments now prioritize cybersecurity training as part of onboarding.
- 47% of employees report using at least three digital tools to manage daily workflow.
- 62% of U.S. offices utilize IoT-enabled devices for energy and access control.
- 39% of HR departments use predictive analytics to guide hiring and retention.
- 77% of U.S. workers say technology has improved work-life balance through flexible scheduling.
- 84% of new hires in 2025 attend at least one virtual onboarding or training session.
Technology Use in Education
- 78% of students in the U.S. participate in hybrid or online learning environments.
- 91% of K-12 schools use learning management systems like Canvas or Google Classroom.
- 67% of college students report submitting over 75% of their assignments digitally.
- 42% of educators use AI-powered tools for grading or personalized learning plans.
- 89% of school districts provide devices such as Chromebooks or tablets to students.
- 56% of students aged 13–18 use educational YouTube channels as supplementary learning tools.
- 74% of parents in 2025 say they regularly access school portals to monitor academic progress.
- 61% of teachers incorporate gamification strategies into online lesson plans.
- 37% of universities offer fully online degrees.
- 48% of public libraries now provide access to online certification platforms like Coursera or LinkedIn Learning.
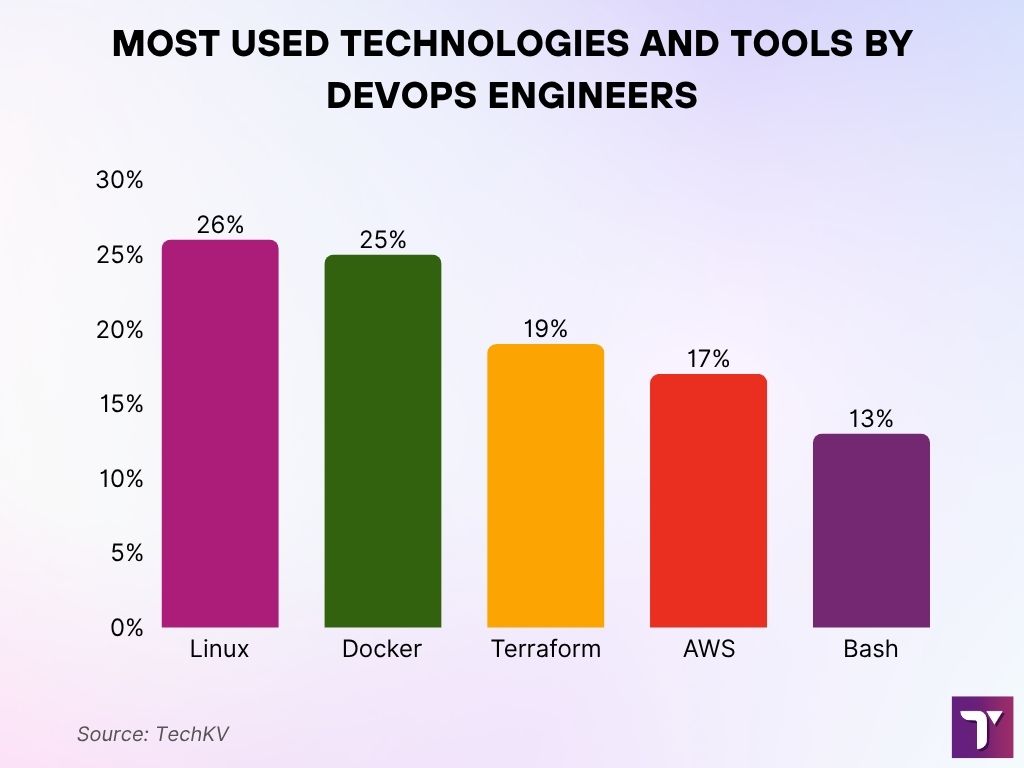
Top Tools DevOps Engineers Rely On
- Linux leads the pack, with 26% of DevOps engineers using it, a testament to its dominance in server environments.
- Docker is a close second at 25%, showing the widespread embrace of containerization in modern workflows.
- Terraform comes in at 19%, underlining the rising popularity of infrastructure as code.
- AWS holds a 17% share, reinforcing its role as a go-to cloud platform for DevOps teams.
- Bash still commands relevance, used by 13% for scripting and automation, proving it’s far from outdated.
E-commerce and Online Shopping
- 82% of online shoppers in the U.S. have made purchases via mobile devices in 2025.
- 31% of consumers report using voice assistants like Alexa or Siri to make purchases.
- 68% of retail revenue comes from e-commerce channels.
- 44% of online shoppers abandon carts due to unexpected shipping costs or fees.
- 76% of consumers trust product reviews more than branded content or ads.
- 57% of shoppers use augmented reality tools to preview products before buying.
- 29% of U.S. households subscribe to at least one recurring product delivery service.
- 64% of Gen Z consumers discover new brands through social media e-commerce integrations.
- 41% of digital buyers prefer same-day or next-day delivery options.
- 89% of retailers use AI for personalized product recommendations in 2025.
- 51% of shoppers say they are more likely to buy from stores offering mobile-exclusive discounts.
- 38% of online purchases are made during late evening hours (9 p.m. to midnight).
- 23% of e-commerce traffic comes from direct links shared via messaging apps.
- 47% of consumers have tried at least one “Buy Now, Pay Later” (BNPL) service in the past year.
Smart Home and IoT Adoption
- 41% of U.S. households use at least one smart home device in 2025.
- 26% of homes are equipped with voice-activated assistants integrated into daily routines.
- 53% of smart home owners use connected security systems such as doorbell cameras or motion sensors.
- 35% of IoT users report energy savings through smart thermostats or lighting systems.
- 22% of smart device owners have experienced interoperability issues between products.
- 78% of new home constructions in the U.S. include smart home readiness infrastructure.
- 67% of smart speaker users use the devices daily for news, weather, or reminders.
- 48% of users control smart devices via smartphone apps while away from home.
- 34% of consumers cite privacy concerns as a reason for not adopting IoT tech.
- 59% of IoT devices in use are focused on convenience and automation rather than security.
- 12% of seniors aged 65+ now use smart home technology to monitor health and mobility.
- 45% of households with children under 10 use parental control features on smart devices.
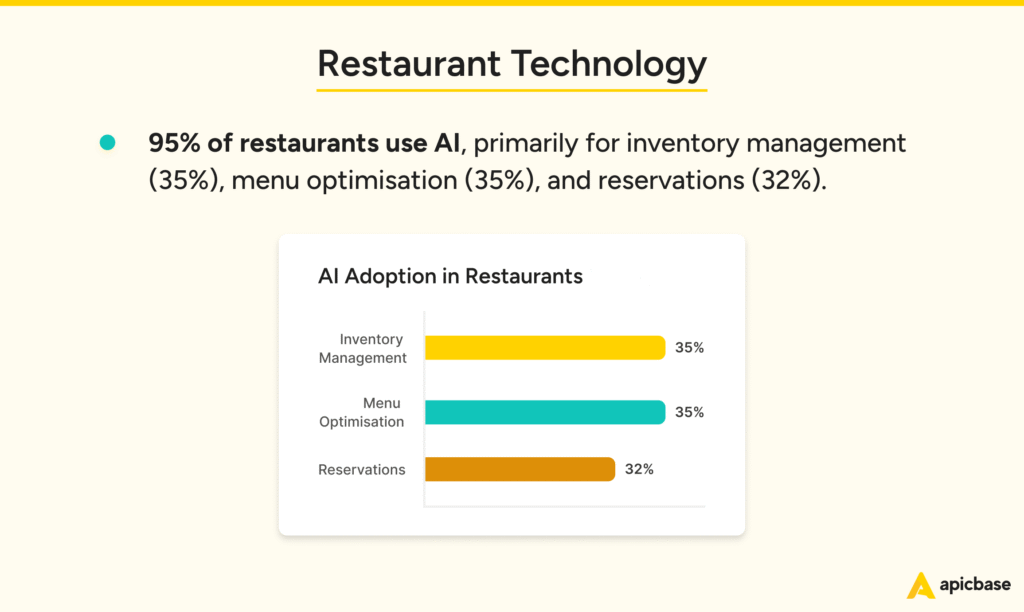
How Restaurants Are Embracing AI
- A massive 95% of restaurants are now tapping into AI technologies to streamline and enhance their operations.
- 35% rely on AI for inventory management, keeping shelves stocked and waste low.
- Another 35% use AI to optimize menus, customizing dishes based on customer behavior and preferences.
- 32% turn to AI for reservation management, boosting booking accuracy and improving the overall dining experience.
Cloud Computing Usage
- 82% of U.S. businesses use cloud storage solutions for daily operations.
- 61% of SMBs (small and mid-sized businesses) rely on SaaS platforms for their workflows.
- 29% of corporate IT budgets are allocated to cloud services in 2025.
- 91% of cloud users express confidence in the security protocols of major providers.
- 57% of remote teams operate entirely in cloud-based ecosystems.
- 43% of IT professionals use hybrid cloud models to balance flexibility and compliance.
- 36% of organizations adopted cloud-native databases over traditional models in 2025.
- 49% of users access personal cloud storage (e.g., iCloud, Google Drive) weekly or more.
- 66% of cloud infrastructure growth comes from the healthcare and finance sectors.
- 87% of developers build applications designed for cloud scalability from the outset.
Artificial Intelligence Adoption
- 59% of workers say AI tools boost their daily productivity.
- 72% of businesses have implemented at least one AI-powered application in 2025.
- 44% of marketing teams use generative AI for campaign content or ad copy.
- 37% of consumer apps now use AI for personalized experiences or recommendations.
- 63% of U.S. enterprises deploy machine learning models for business insights.
- 28% of job seekers use AI résumé builders or career coaching platforms.
- 51% of healthcare institutions use AI for diagnostics or patient data analysis.
- 46% of AI adopters report challenges with bias and ethical compliance.
- 35% of U.S. adults are concerned about AI replacing jobs in their industry.
- 79% of college students use AI-based tools for study support or plagiarism checks.
- 18% of creative professionals use AI to generate music, images, or design prototypes.
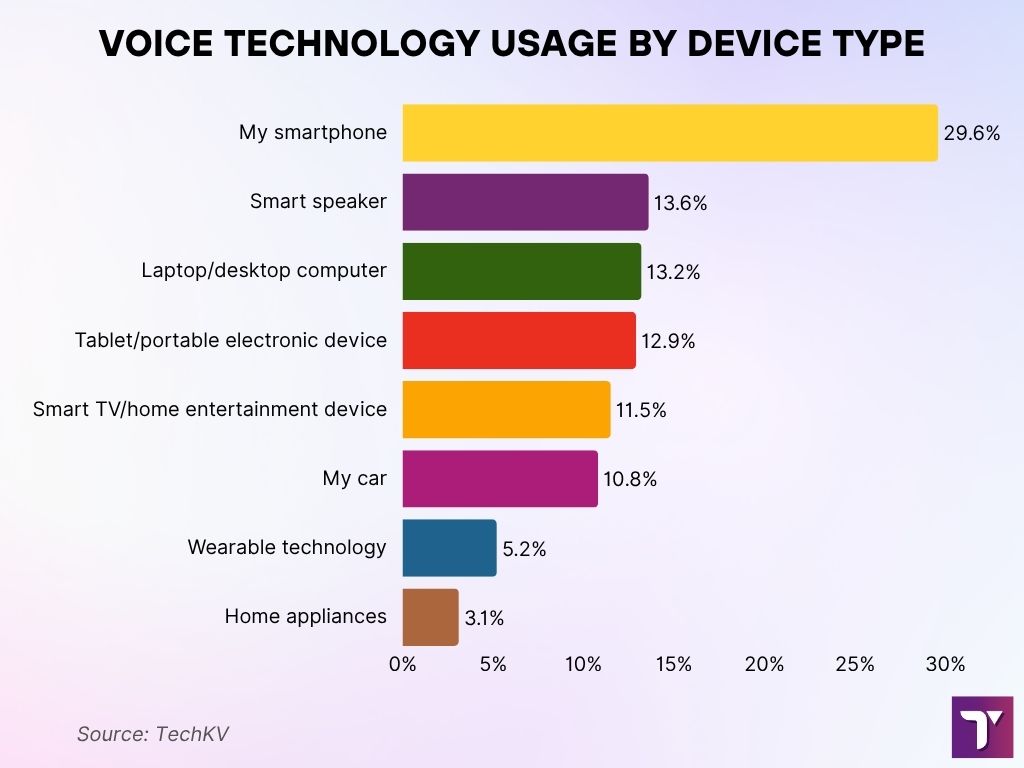
Where People Use Voice Tech the Most
- Smartphones dominate voice tech use, making up 29.6% of all interactions, the top choice for voice commands.
- Smart speakers come next at 13.6%, highlighting their strong presence in households.
- Laptops and desktops contribute 13.2%, showing that voice tech is also a tool for productivity.
- Tablets and other portable devices follow closely at 12.9%, offering on-the-go convenience.
- Smart TVs and home entertainment systems account for 11.5%, reflecting growing hands-free media control.
- Cars with voice assistants take 10.8%, showing steady use while driving.
- Wearables, like smartwatches, register 5.2% of usage, small but steadily rising.
- Home appliances bring up the rear at 3.1%, but their role is expected to expand with smart home adoption.
Technology Use in Healthcare
- 51% of healthcare providers use AI-assisted tools for diagnostics or triage.
- 68% of patients have booked appointments or accessed test results through online portals.
- 44% of hospitals offer telehealth as a default option for non-emergency consultations.
- 76% of clinics store medical records in cloud-based platforms for secure access.
- 32% of health apps in 2025 include mental health tracking and support features.
- 88% of wearable device users track at least one health metric daily.
- 39% of U.S. adults say digital health tech has helped them better manage chronic conditions.
- 53% of employers offer telehealth as part of their health insurance package.
- 27% of pharmacies use automated refill systems triggered by app notifications.
- 41% of doctors have integrated virtual reality or simulation tools for training or patient education.
Technology and Digital Media Consumption
- 6.9 hours is the average daily screen time across all devices for U.S. adults.
- 94% of Gen Z stream content weekly on platforms like YouTube, Netflix, or Twitch.
- 72% of U.S. adults listen to digital audio, including podcasts or streaming music services.
- 39% of households have replaced cable TV entirely with streaming subscriptions.
- 48% of mobile users consume short-form video content as their preferred media format.
- 28% of users aged 50+ subscribe to at least one streaming service.
- 61% of U.S. adults say they discover new content primarily through algorithmic recommendations.
- 33% of users pay for ad-free versions of digital platforms.
- 85% of podcast listeners stream content while multitasking, such as commuting or exercising.
- 43% of digital media time is spent consuming user-generated content across social platforms.
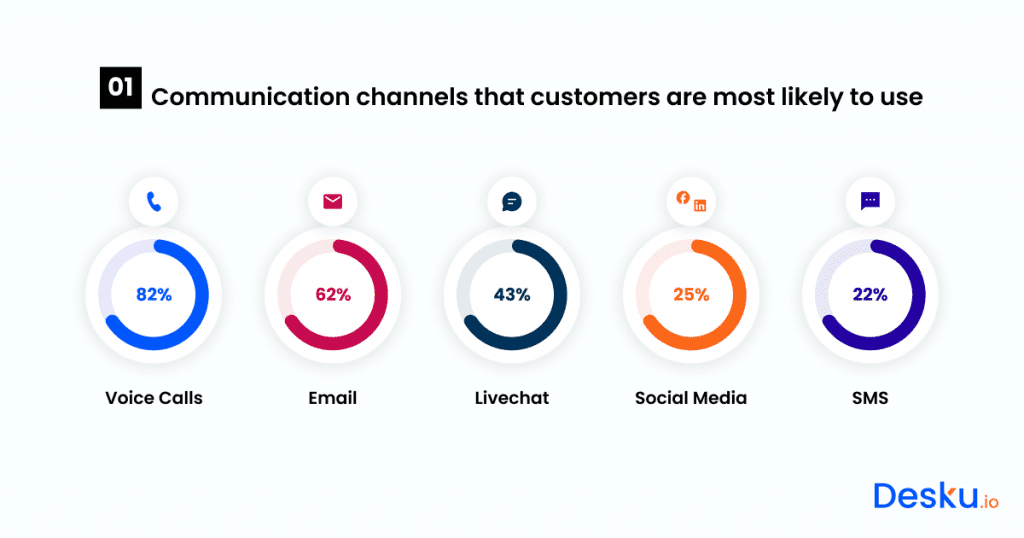
How Customers Prefer to Connect with Businesses
- Voice calls reign supreme, with 82% of customers still choosing to pick up the phone for support.
- Email remains a strong favorite at 62%, offering a reliable and formal way to communicate.
- Live chat appeals to 43% of customers, showing a clear preference for real-time help.
- Social media is used by 25%, reflecting its growing role in brand interactions.
- SMS sits at the bottom, with just 22% opting for it, still useful, but less preferred overall.
Popular Software and Applications
- 96% of working professionals use productivity apps like Zoom, Google Workspace, or Microsoft 365.
- 88% of Gen Z actively use at least five mobile apps per day.
- 54% of users employ a password manager or digital vault for security.
- 61% of U.S. adults have used a digital budgeting or banking app in the last 30 days.
- 49% of remote teams rely on project management tools such as Trello or Asana.
- 74% of students use AI writing or grammar tools like Grammarly or ChatGPT for academic tasks.
- 27% of U.S. adults use meditation or mindfulness apps at least once per week.
- 31% of users delete unused apps monthly to free up storage or reduce distractions.
- 67% of app users say usability and intuitive design are key factors for retention.
- 58% of smartphone owners use health tracking or fitness-related applications regularly.
Cybersecurity and Privacy Behaviors
- 62% of U.S. adults report using two-factor authentication for at least one account.
- 46% of internet users updated their privacy settings in the past three months.
- 89% of IT departments in U.S. companies conduct regular cybersecurity training.
- 37% of U.S. adults say they are “very concerned” about AI-enabled data collection.
- 55% of Americans use a VPN when accessing public or unsecured Wi-Fi networks.
- 21% of consumers experienced at least one phishing attempt in the last year.
- 72% of smartphone users restrict app tracking permissions by default.
- 49% of business leaders cite ransomware as their top cybersecurity threat.
- 28% of users aged 60+ actively use antivirus software across all devices.
Conclusion
From smart speakers that wake us up to AI copilots that guide our workdays, 2025 is shaping up to be a landmark year in our digital journey. Americans now interact with technology more frequently, more personally, and across more domains than ever before. While convenience and innovation dominate headlines, access and equity remain the next frontiers. As tech becomes more embedded in daily life, staying informed about how it’s shaping our routines and who it leaves behind is more important than ever.
