Machine learning continues to reshape industries, offering smarter automation, sharper insights, and faster decisions. Today, 48% of businesses globally employ some form of machine learning, and 92% of leading firms have invested in ML/AI technology. In finance, hedge funds such as AQR are now using ML-based algorithms to manage multi-billion-dollar investments, with the industry expecting up to 200,000 job cuts in banking by 2027. In customer service, ML-based algorithms help reduce translation errors by 60% and cut operational costs for 38% of companies. Read on to explore the full article and learn how machine learning stats are influencing business today.
Editor’s Choice
- Globally, the machine learning market is projected to hit approximately $48 billion in 2025, growing to $310 billion by 2032 at a CAGR of about 30.5 %.
- The U.S. ML market alone generated $12.36 billion in revenue in 2024, expected to reach $44 billion by 2030 (22.7 % CAGR).
- North America’s ML sector was valued at $21.56 billion in 2024, with a projected CAGR of 35.3 %, the fastest in the global forecast.
- As of 2024, 78 % of organizations report using AI in at least one business function, up from 55 % in 2023.
- U.S. private AI investment reached $109.1 billion in 2024, dwarfing China’s $9.3 billion and the U.K.’s $4.5 billion.
- ML services dominated the U.S. market in 2024, while hardware is the fastest-growing segment.
- Generative AI drew $33.9 billion in global private investment in 2024, up nearly 19% from the previous year.
Recent Developments
- Tech giants Microsoft, Amazon, Meta, and Alphabet are projected to spend $340 billion on AI infrastructure in 2025.
- McKinsey forecasts $7 trillion in global AI investment over the next five years.
- AI labor demand continues to surge, and ML-related hires rose 42 % year-over-year in India in June 2025, signaling global demand.
- AI is influencing labor markets. U.S. unemployment among young tech workers (20–30) rose nearly 3 percentage points since early 2024, more than four times the national average.
- Goldman Sachs projects generative AI could displace 6–7 % of the U.S. workforce over a decade, though peak unemployment may stay under 0.5 percentage points.
- AI is enabling major corporations like Microsoft to automate over one-third of current employee tasks.
- Stanford’s 2025 AI Index reports record private AI investment and expanding government activity, with AI-focused legislation doubling in the U.S. since 2022.
What Is Machine Learning?
- Machine learning refers to algorithms that learn from data to make decisions or predictions, and is now a core part of generative AI, computer vision, and NLP applications.
- 64 % of senior data leaders in 2024 deemed generative AI the most transformative technology of a generation.
- ML solutions number 281 offerings on Google Cloud Platform, with 195 as SaaS or APIs as of January 2024.
- ML powers smart automation, from recommendation engines to fraud detection, where ML reduces errors by 60 % and saves Netflix an estimated $1 billion annually.
- In healthcare, ML predicted COVID-19 patient outcomes with 92 % accuracy.
- ML underpins generative AI, which grew from 33 % usage in 2023 to 71 % in 2024 across business functions.
- In 2024, ML domains expanded into marketing, service operations, and IT, raising adoption depth across sectors.
Machine Learning’s Projected Economic Gains
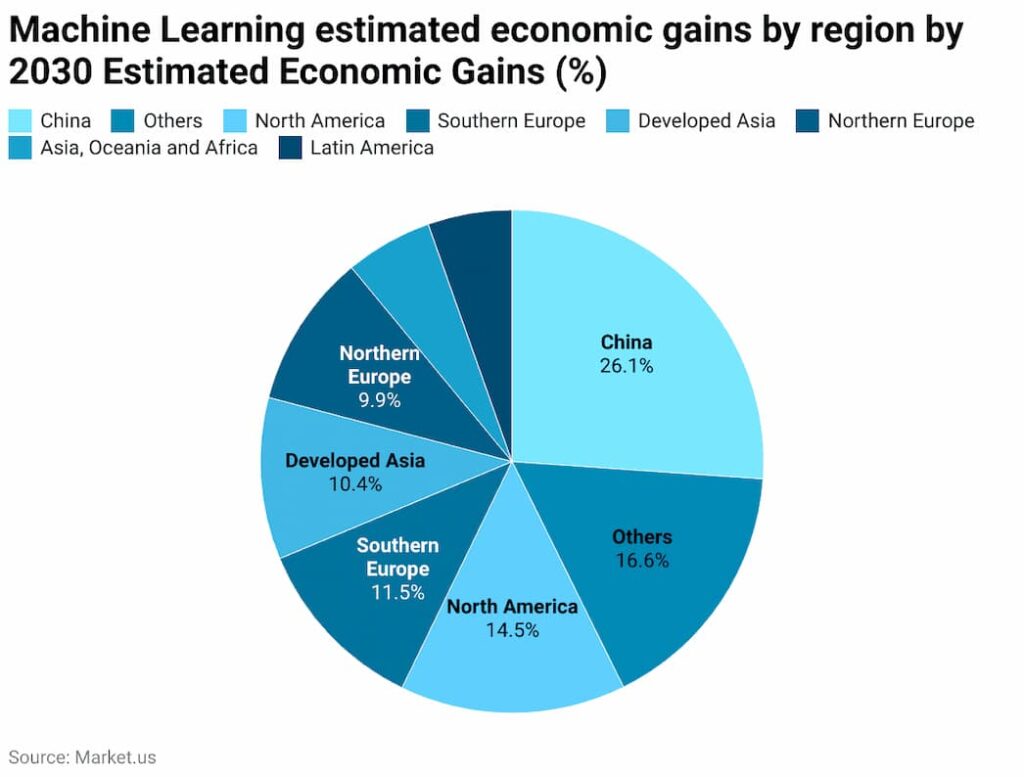
- China is expected to see the largest share of gains, accounting for 26.1% of global economic benefits from machine learning.
- Other regions combined contribute a significant 16.6%, showing the widespread global adoption of machine learning.
- North America follows with 14.5%, reflecting strong investment and innovation in AI technologies.
- Southern Europe is projected to achieve 11.5%, highlighting steady growth potential in the region.
- Developed Asia (excluding China) is forecasted to secure 10.4%, driven by advanced digital economies like Japan and South Korea.
- Northern Europe contributes 9.9%, emphasizing its leadership in technology adoption and AI integration.
- Asia, Oceania, and Africa, as well as Latin America, represent smaller portions, but together they underline the global reach of machine learning’s impact.

Applications of Statistics in Machine Learning
- ML algorithms rely on descriptive statistics, means, variances, and distributions to summarize features for pattern detection.
- Regression analysis helps predict continuous outcomes, such as demand forecasting or price estimations.
- Classification tasks use statistical metrics (e.g., precision, recall, ROC AUC) as model evaluation metrics.
- Hypothesis testing and ANOVA guide feature selection and assess significance among data groups.
- Bayesian statistics allow models to update predictions as new data appears, core in reinforcement learning and adaptive systems.
- Correlation and covariance matrices help identify multicollinearity and feature relationships for dimensionality reduction.
- Probability theory underpins probabilistic models like Naive Bayes and helps estimate uncertainty.
- Bias–variance analysis balances model flexibility and reliability to avoid overfitting or underfitting.
- Inferential statistics support generalizing findings from sample data to wider populations.
- Preprocessing steps such as outlier handling, normalization, and missing data treatment rely on statistical assumptions.
Key Insights on Leading Machine Learning Use Cases
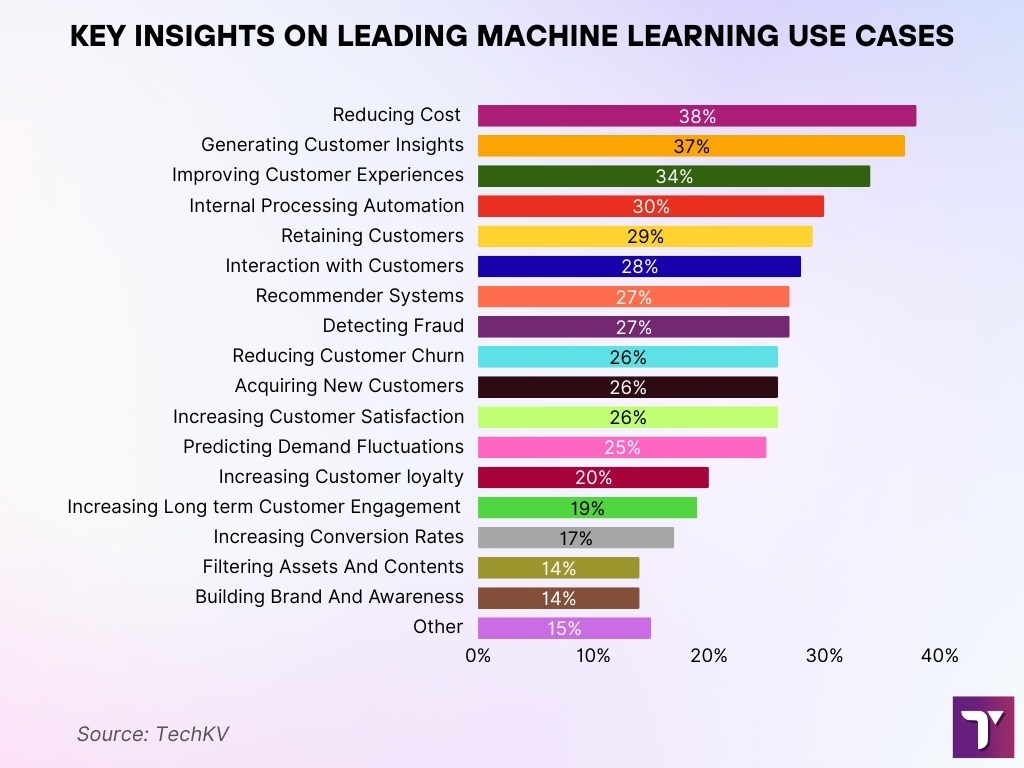
- Reducing costs (38%) is the top use case, showing ML’s strong role in operational efficiency.
- Generating customer insights/intelligence (37%) closely follows, highlighting the demand for data-driven decision-making.
- Improving customer experience (34%) ranks third, reinforcing ML’s importance in personalization and service quality.
- Internal processing automation (30%) demonstrates how businesses rely on ML to streamline workflows.
- Retaining customers (29%) and Interacting with customers (28%) are critical for customer lifecycle management.
- Recommender systems (27%) and Detecting fraud (27%) reflect both revenue growth and risk management use cases.
- Reducing customer churn (26%), Acquiring new customers (26%), and Increasing customer satisfaction (26%) all tie, showing ML’s dual focus on retention and growth.
- Predicting demand fluctuations (25%) points to ML’s value in forecasting and supply chain optimization.
- Increasing customer loyalty (20%) and Long-term customer engagement (19%) demonstrate ML’s role in sustaining relationships.
- Increasing conversion rates (17%) connects ML directly to sales performance.
- Filtering assets and content (14%) and Building brand awareness (14%) show ML’s impact on marketing.
- Other (15%) indicates a variety of niche or emerging ML applications beyond the listed categories.

Types of Statistics
- Descriptive statistics summarizing datasets with measures like mean, median, mode, and standard deviation.
- Inferential statistics involves making predictions or generalizations from sample data.
- Bayesian statistics, updating belief distributions based on observed evidence.
- Regression statistics, modeling relationships between variables to predict outcomes.
- Hypothesis testing / ANOVA, confirming or rejecting assumptions about population parameters.
- Probability theory, modeling randomness, and event likelihoods are central to classification and risk estimation.
- Correlation and covariance, identifying linear dependencies among features to guide feature engineering.
Descriptive Statistics
- Descriptive statistics simplify complex datasets with measures like mean, median, and mode to convey central tendencies.
- They also include measures of dispersion, such as variance, standard deviation, and range, to highlight spread and variability.
- Histograms, boxplots, and frequency charts visualize data distribution for a better grip on its shape.
- Data cleaning benefits from descriptive stats, spotting outliers, and identifying inconsistent values becomes easier.
- They guide model selection by revealing distribution traits like normality or skew, helping choose suitable algorithms.
- Central measures support initialization of many ML models and sampling assumptions.
- Dispersion measures flag variance that may harm sensitive algorithms like k-NN or SVM.
- Frequency distributions help detect imbalances in classification tasks, critical for fair modeling.
Machine Learning Market Growth
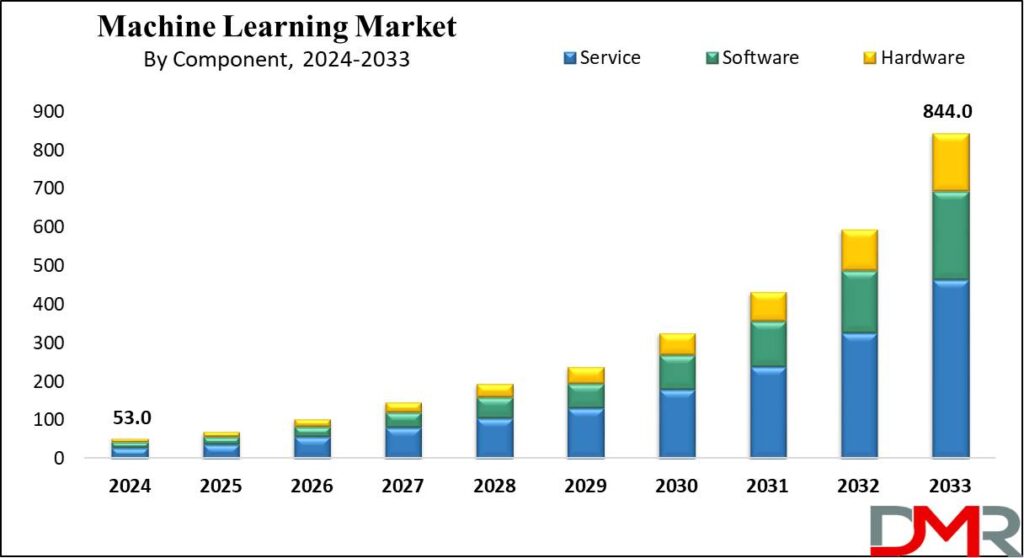
- The global Machine Learning Market is expected to grow from $53 billion in 2024 to $844 billion by 2033.
- The market is segmented into Service, Software, and Hardware components.
- Service segment leads the market:
- Starts at $35B in 2024.
- Expands steadily to $460B in 2033, making it the largest contributor throughout the forecast period.
- Software segment shows strong momentum:
- Valued at $12B in 2024.
- Grows more than 20x, reaching $250B in 2033.
- The hardware segment also scales significantly:
- Begins at $6B in 2024.
- Surges to $134B by 2033, reflecting rising demand for ML-focused computing infrastructure.
- The fastest acceleration in growth appears after 2030, where the market jumps from $320B in 2030 to nearly $844B by 2033.

Measures of Central Tendency and Dispersion
- The global ML market is projected to be $113.1 billion in 2025, with a mean market value growing steadily toward $503.4 billion by 2030.
- The median enterprise adoption among businesses globally stands at nearly 48% using ML.
- Standard deviation for U.S. ML adoption across firms is high, while 34% actively use ML, many more (42%) remain exploratory.
- North America’s ML market at $21.56 billion (2024) reflects both mean and regional weighting in volume (the largest share regionally).
- 24.3% of Python functions from U.S. developers were AI-generated by the end of 2024, compared to a 30.1% generation rate, highlighting adoption distribution across user populations.
- Generative AI usage in business functions rose from a mean of 65% (early 2024) to 71% (end of 2024).
- The global AI market in 2025 is valued at $391 billion, with dispersion expected to be wide as some segments lead faster.
- The wearable AI market reached $180 billion in 2025, showing significant segment-level variance.
Measures of Shape (Skewness, Kurtosis)
- The distribution of ML market sizes among regions is skewed; North America and Europe dominate, while Asia‑Pacific shows higher growth rates but lower absolute size.
- U.S. firms using AI rose from 5.7% (Dec 2024) to 9.2% (Q2 2025), illustrating a right‑skew in adoption acceleration.
- Among business functions, IT and marketing–sales pull adoption to the right, while functions like service ops skew trail behind.
- Generative AI saw a rapid uptick, from 65% to 71%, reflecting positive skew in adoption toward widespread deployment.
- ML-generated Python code reached 30.1% of U.S. developers, compared to 11.7% in China, highlighting large kurtosis in adoption by geography.
- The wearable AI segment hitting $180 billion suggests a fat‑tail distribution in device categories.
- ML market growth projections to $503.4 billion by 2030 from $79.29 billion reflect a strong right‑tail continuation of growth distribution.
Bayesian Statistics
- Bayesian methods update prior beliefs with new data to form posterior distributions, enabling adaptive learning.
- Bayesian models quantify uncertainty, delivering full predictive distributions, not just point estimates.
- They’re popular in reinforcement learning and adaptive systems, where environments shift dynamically.
- In medicine and finance, Bayesian approaches assist in risk modeling by continuously integrating new observations.
- Bayesian neural networks add uncertainty estimations to deep learning, aiding reliability.
- Techniques like MCMC (Markov Chain Monte Carlo) and variational inference power high-dimensional Bayesian models.
- Bayesian methods support small-data learning, where priors compensate for limited observations.
Bias and Variance in Machine Learning
- Bias refers to systematic errors that arise from overly simplistic assumptions in models.
- Variance indicates how much model predictions fluctuate based on different training data samples.
- Finding the bias–variance trade-off remains essential to balance underfitting and overfitting.
- The recent concept of double descent shows that beyond a certain model complexity, performance may improve again, challenging classical views.
- Modern deep learning often operates in this post-interpolation regime, achieving lower test error despite high capacity.
- Regularization, cross-validation, and early stopping remain key tactics to manage this trade-off.
- Accurate bias–variance decomposition assists in model diagnostics and clarifies sources of error.
- Understanding this balance is critical in high-stakes applications, where both bias and fluctuation carry risk.
Model Evaluation Metrics
- For classification, common metrics include accuracy, precision, recall, F1 score, and ROC-AUC.
- In regression, practitioners rely on MAE, RMSE, and R-squared to gauge performance.
- Metrics like log-loss and Brier score evaluate probabilistic forecasts.
- Cross-validation scores provide stable estimates of model performance across datasets.
- Confusion matrices reveal detailed performance breakdowns, useful for imbalanced data.
- In 2025, organizations report 20–30% improvement in recall by optimizing for F1 instead of plain accuracy.
- Calibration metrics, like reliability curves, ensure probabilities are well-aligned with real-world outcomes.
- Model comparison frameworks, including statistical testing, enable confident selection between competing versions.
Feature Selection and Data Preprocessing
- Data preprocessing includes missing value handling, normalization, outlier detection, and encoding categorical variables.
- Feature selection methods like filter, wrapper, and embedded approaches help reduce dimensionality and improve performance.
- Techniques such as PCA and LASSO identify and retain the most useful features.
- In 2025, preprocessing pipelines typically improve efficiency, reducing model training time by 10–40% in enterprise setups.
- Methods like SMOTE and undersampling mitigate imbalance in classification datasets.
- Automated feature engineering platforms are now standard in many industry workflows.
- Proper data cleaning and selection often yield more gains than hyperparameter tuning alone.
Global Machine Learning Market Size & Forecasts
- In 2024, the global ML market was valued at $35.3 billion, projected to reach $48 billion in 2025, and surge to $309.7 billion by 2032 (CAGR ~30.5 %).
- Alternatively, another estimate pegs the 2024 figure at $72.6 billion, rising to $100 billion in 2025, and expected to cross $419.9 billion by 2030 (CAGR ~33.2 %).
- A third forecast projects $93.9 billion in 2025, growing aggressively to $1.41 trillion by 2034 (CAGR ~35.1 %).
- North America dominated the 2024 market with ~32% share and shows the fastest regional growth (CAGR ~35.3 %).
- By industry, healthcare currently leads, with retail poised for rapid expansion.
- Cloud deployments dominate, although on-premise solutions are steadily growing.
- In 2025, 92% of company leaders indicate plans to invest significantly in AI/ML by 2028, reflecting enduring confidence.
- Global IT spending is expected to top $5.43 trillion in 2025, a 7.9% rise from 2024, with AI and generative AI leading growth; data center systems alone will expand 42.4%.
Conclusion
Machine learning stands at a pivotal crossroads, reshaping business, science, and society through improving models, adaptive frameworks, and soaring market scale. We’ve explored foundational statistics, from descriptive measures to bias–variance dynamics, and how they empower smarter model design and performance. Meanwhile, global forecasts forecast monumental growth, potentially reaching hundreds of billions to over a trillion dollars in the near future. As companies align with these trends, understanding the stats behind ML isn’t optional; it’s vital. Explore the data, test your models, and let these numbers guide your innovation journey.
